This the second part of three part case study where we see what happens when high school students clone and sequence genomic plant DNA. In this part, we do a bit of forensics to see how well their sequencing worked and to see if we can anything that could help them improve their results the next time they sequence.
How well did the sequencing work?
Anyone who sequences DNA needs to be aware of two kinds of problems that afflict their results. We can divide these into two categories: technical and biological.
Technical problems are identified using quality values and the number of bases with quality values above a certain threshold. Biological problems are identified by using the DNA sequence itself. If we find that our sample contains only low quality bases, we have a technical problem. Maybe a capillary was plugged, maybe our PCR's failed. If we find that all of our clones correspond to DNA sequences from our vector, we had a biological problem. Maybe our cloning didn't work, maybe we used the wrong primers, or sequenced the wrong samples.
Both Sanger and Next Generation DNA sequencing technologies can suffer from both kinds of problems, but we can identify and minimize the problems if we use the information that we capture from our work.
In part I, I wrote about the background for this experiment. In this part of the study, I'll describe how we identify the technical issues and part III, we'll talk about the biological issues.
Let's begin.
Identifying technical issues
Selecting Reports brings us to a page with a table showing all the data from every time the sequencing instrument was run. This class ran the sequencer on two different days.
Since the instrument was run on consecutive days, we can see all the data summarized if we select the Runs by Month or Runs by Week tabs. Those data show us that only 54% of the samples passed overall.

We can also see a summary for each day by selecting the Runs by Day tab.
Okay, about half of the samples worked, half didn't.
Is there something we could learn that could help the students do better next time?
Maybe.

If we select the Runs by Day tab, we see that the results were quite a bit better on the first day than the second (63.6% of the reads passed on the first day and only 46% on the second). Did the class do all their reactions on one day and store their samples overnight? If the samples were stored overnight in a self-defrosting freezer, they might have degraded somewhat before they were loaded on the instrument.
Or could there be something going on with the instrument? Could there be a problem with some of the capillaries? We'll look at that possibility in a moment.
It could also be that the students who loaded the samples on the first day had better technique, or maybe some other factor is to blame. Just as laboratory professionals use this kind of information to improve their process, a teacher can use this information to improve the success rate for their class.
What does it mean to pass?
At this point, you might be wondering how we define passing. In this version of iFinch, we decided that a read must have at least 80 bases with quality values above 20 in order to pass.
What's a quality value?
Quality values measure our confidence in our ability to correctly identify a base. The quality value is defined as negative ten times the log of the error probability. A quality value of 20 has an error probability of 0.01 or 1%. A base with a quality value of 20 would be identified correctly 99 times out of a 100. Often a quality value of 20 is used as the threshold value for acceptability. We use the number of Q20 bases to measure the success of our sequencing experiments.
More information about the experiment
Don't go away yet, there's still more data that we might want to check out. Clicking the Runs by Sequencer link takes us to a page that summarizes the data quality from all the runs. From this page, we learn that the sequencer was an ABI 3100 Genetic Analyzer. Clicking the number of runs takes us to a graph that shows us the results for every capillary on every day.
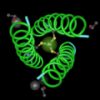
In this graph, it looks like the first two capillaries worked the best and the second two capillaries rarely worked. These graphs are great for identifying plugged capillaries or plugged fangs in micropipettors or robots. We can click any one of these squares to see the data for that sample. If I click a bright green square, I can see that the data look really good.

If I click a dark green or black square, I either see that there either aren't any data or that the data I find aren't very good. This sequence passed, but just barely. The dotted line marks the position of a quality value of 20 and you can see that most of the bases are below the line.
So far, we know that about half the samples had at least 80 Q20 bases and next time we might test the prediction that overnight storage is a bad thing. But what did we clone?
That's tomorrow's post.
- Log in to post comments