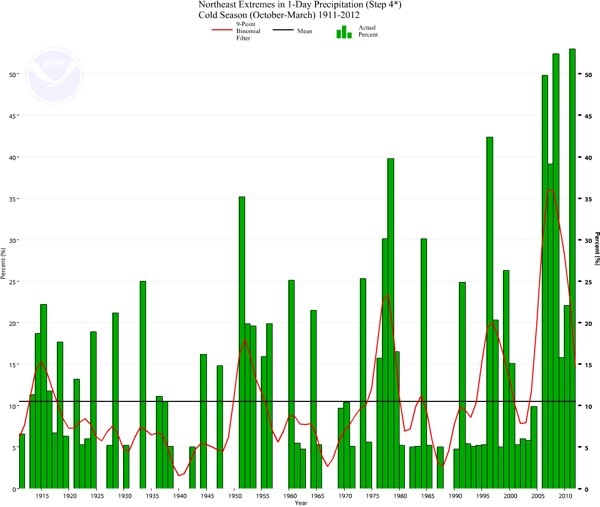
This graph shows the extremes in one-day precipitation in a given month relative to the amount of precip in that month for the Northeastern US. So, if the green bar is at 30%, that means that that 30% of month's precip fell in one event. The way this is computed is a little complicated because it is hard to define an "event" in time and space in relation to the time and space coordinates (as it were) we normally use. Check the source of the graph for a more detailed explanation. The point of this graph is that the opposite is true from what many expect: It isn't the case that the snow was deeper back when you were a kid. It's deeper now! (Check out this blog post for an explanation for why you may have misremembered your childhood.) There are a number of contributing factors to a pattern like this, with increasing extreme events, but the best way to think of this may be as an increase in the bimodality of the water cycle. Dry events are dryer (you may have noticed widespread drought) and wet events are wetter (as shown in this graph).
Advertisment

Thank you for your expertise.
Can you give your brainstorming for me?
I would like to speculate on why extreme temperature changes over the course of 1-2 days -
How is it that temperature difference can be followed by rushes of wind in the same location within a 24-36 hour period following?
I am very serious and honor your opinion. I am a Liberal Studies graduate from Charter Oak State College and an Associates General Studies graduate from Gateway Community College, particularly:
I speak of the engineering term - Optimization and the electrical term V=IR, Voltage = Amperage (times) Resistance.
I am a Christian:
Bless you,
Richard B. Robinson, Jr
My reference is President Dorsey Kendrick of Gateway Community College in New Haven Connecticut.
Thank you for giving your reply.
I have just sent a message and would like a reply.
Blessing,
Richard Blackstone Robinson, Jr.