
We are reaching the point where Arctic Sea ice tends to max out, in terms of extent (I will not be talking about volume here, though that is vitally important). Using data provided by the National Snow and Ice Data Center, I ran an informal "Science by Spreadsheet" analysis and came up with a prediction for the minimum extent of sea ice this year, which would be some time in September.
This is mostly a seat of the pants analysis and don't take it too seriously, but feel free to put your bets in the comments section.
The data over the last few decades shows a generally declining extent of sea ice, especially at the minimum in September. But the maximum extent (where we are now, typically) seems uncorrelated to the minimum extent. Different processes are involved at different times of the year. Also, the shape of those data indicate to me a shift form a slower annual decline to a faster annual decline, happening some time around 1995 or 1996. So, I used September data only from 1996 to last year. I ran a simple regression analysis and from the model it produced I calculate that the AVERAGE September value of sea ice (an odd number that no one ever uses, but I have it anyway) will be 4.1 million square kilometers.
Using the minima for September for this range of years, the MINIMUM sea ice extent for 2014 is predicted to be 3.9458 million square kilometers.
This places this year's minimum above the extraordinary year of 2012, which to cherry picking denialists will mean a "recovery" (though it isn't) but below any prior year. The value will be somewhere in the crudely drawn box on this chart:
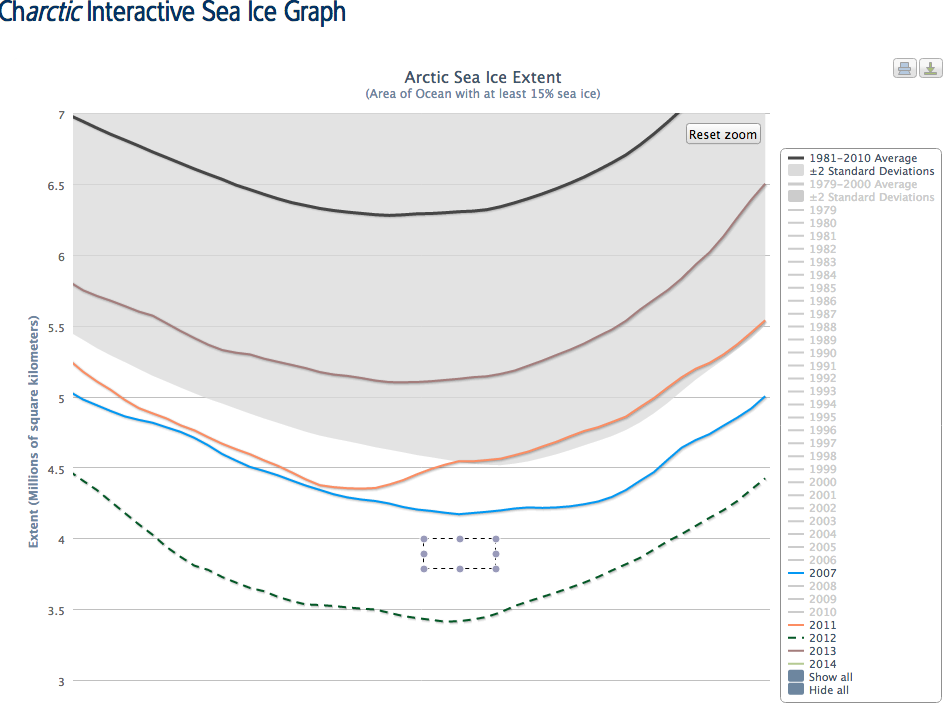
We'll see.
The other thing going on right now, obviously, is the shift from adding ice to removing ice that happens as the seasons shift. It looks like the ice may be starting its seasonal decline now, but in previous years, the squiggly line representing sea ice extent has continued to squiggle up and down for a few more days. In a week or so I think we'll have a better idea. But it is quite possible that the highest value was reached over the last few days. Again, we'll see.
What is the scale on the x-axis?
It doesn't look good.
http://neven1.typepad.com/.a/6a0133f03a1e37970b01a3fccef108970b-pi
The Arctic ice melt period is getting longer, which increases the amount of heat absorbed. Old ice has dropped from around 70% in the 80s to around 20% today.
http://www.sciencedaily.com/releases/2014/03/140304125925.htm
http://www.climate.gov/file/amount-old-ice-arctic-1987-2013
Km sq x 10^6
Sorry, you sakes about x not y. Time, this is basically showing September AT&T he low point
Damn you autocorrect.
Autocorrect is exposed as a climate change denier………..
Actually, comparing to the original graph, it appears to be August 20 - October 11.
5.3 MM km2
Now that it's September, how close was your prediction?
Calamity, that was a prediction for last year. I was off, there was more ice at the end of the season. This year is closer to my prediction for last year, third or fourth lowest.