
Some time in the 1970s.
I keep hearing about this 17 year long pause in global warming. So I went and looked. I did a regression analysis of the last 17 full years of surface temperatures from the GISS database. There is an upward trend in warming during this period and it is statistically significant.
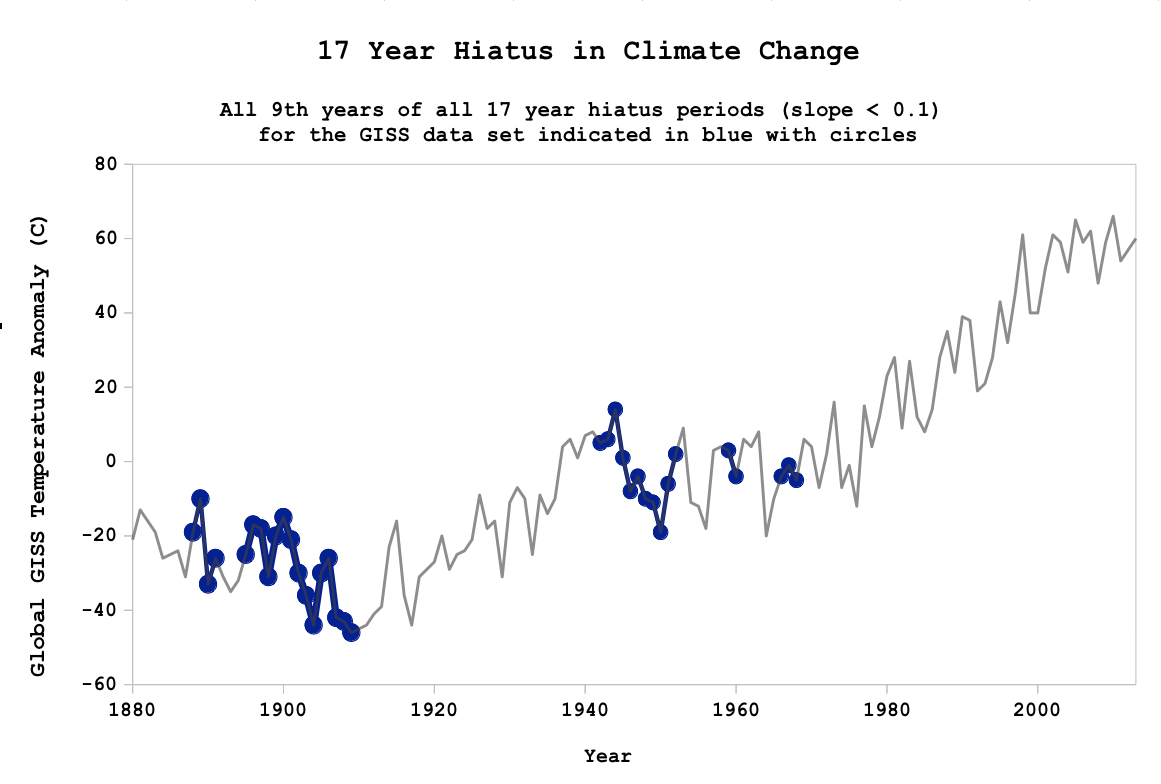
Then I calculated a "running slope" over 17 year long periods from the beginning of the record (plus 8 years) to the end of the record (minus 8 years). For each slope I tested to see if the slope was less than +0.1 (the average slope across the record is 0.75). If a year centered on any 17 year period had a low or negative slope as defined, I counted it as a year in a Hiatus. I then made a chart showing when these hiatuses happened. They used to be more common, but it has been quite a while since the last one:
Since 2014 is not over yet, I did not include it. But, the last "year" (12 month interval) was the warmest 12 month interval for the entire record. 2014 is likely to be in the top two or three warmest years globally on record, quite possibly the warmest. That is not going to help the now discredited hiatus theory very much.
- Log in to post comments
Great work.
Well, I don't think there's actually a "pause" at the moment despite the myth and as the Bad Astronomer Phil Plait points out here :
http://www.slate.com/blogs/bad_astronomy/2013/12/16/global_warming_new_…
Plus here :
http://www.slate.com/blogs/bad_astronomy/2013/11/05/climate_pause_nope…
with bonus youtube clip of NASA climatologist Josh Willis.
It seems, as this clip, by Potholer54 observes here :
https://www.youtube.com/watch?v=Qbn1rCZz1ow&feature=plcp
That the story was basically a very bad journalists invention refuted by the supposed source of the story - the British Met Office.
So never mind the last pause, there isn't one now - but still good work I think Greg Laden.
If the criterion is the most number of years required for statistical significance since 1974 then 1977 and 1979 both needed 19 years of data, beginning with those years, to show statistically significant warming.
From memory the IPCC used the term "hiatus" in their report. Hiatus does mean pause, but it can also mean a break in a series. I took it as the IPCC referring to the temps not rising as fast as they had in previous decades.
Must read the report again sometime.
Harry, a search of all of the assessment reports comes up with the word "hiatus" only in one report (1995) and in reference to the last deglaciation. If you know of any actual other reference in the reports, please cite where.
Chris, the entire sequence shows statistically significant warming. The last 17 years shows statistically significant warming. One of the problems with the hiatus idea is that for much of the data you can't get a very good p value for any slope for any time period as short as 16 or 17 years because there is too much variation in the data itself. However, as I said, the last 17 years to produce a significant result, and generally, any similar time period over the last several decades gives significant results because the upward slope is sufficient in relation to the variation. For earlier periods, i.e., before the 1970s, the rate of warming was low enough that you only get significance for longer periods.
There are only two ways to get a hiatus for recent years. One is to use data OTHER THAN surface warming, which is cheating because we are talking about a hiatus in surface temperature increase. The other is to not use stats at all, but to draw a line from a recent very warm El Nino year to a more recent year, which give you a flat line.
Even that second, totally invalid, method will stop working in a couple of months if 2014 ends up being the warmest year on record, and it will be even less flat if the next year is similar or warmer.
Greg Laden,
The report I refer to is titled "Climate Change 2013
The Physical Science Basis
Working Group I Contribution to the
Fifth Assessment Report of the
Intergovernmental Panel on Climate Change"
http://www.climatechange2013.org/images/report/WG1AR5_ALL_FINAL.pdf
I have trouble remembering the titles :-) I always thought of this one as the "IPCC AR5 Report" but I better have a look at the others to be sure.
The IPCC call it a "hiatus", not a pause and they define it. I was wondering that maybe the IPCC did not mean a pause, but rather a break in a series. The IPCC do not use the term "pause". The media afterwards tended to use the word "pause" instead of "hiatus" - a miscommunication?
I'm aware of that but that was beside the point.
Denialists won't put any value on that explanation whatsoever. They'll simply say it just demonstrates a lack of statistical significance which to them means there is a hiatus. My point was that there is nothing unusual about needing 19 years of data in the modern global warming period for "statistical significance" so if that many years are needed recently or soon then that is no big deal. Whenever I make this point to denialists they suddenly become struck dumb.
Of course, the rate of rise is not statistically significantly lower than the long-term rate of rise. Stating this fact usually gives denialists apoplexy.
Chris, exactly. I had thought about exploring that problem in my post but I was too busy. There is a number of years for which you can't say "hiatus" statistically, though that number changes over time as the curve gets steeper.
IPCC AR5 WG1 Final reporthas the word 'hiatus' like 40-50 times.
http://www.climatechange2013.org/report/
Go talk to to the IPCC to improve your reading comprehension blogger.
Also how about doing the same with HadCRUT4 and NCDC SAT's.
AFAIK, the past ~16 years are NOT statistically significant at the 95% confidence interval (meaning 2.5% at either end).
Teh stupid, it burns.
Everett, perhaps, but not according to the IPCC's own search engine. Please be so kind as to supply 40 or 50 citations for that so we can all be less stupid.
Yes, the last 17 years of temperature change produces a positive slope that is statistically significant.
Harry: Found it.
"Despite the robust multi-decadal warming, there exists substantial
interannual to decadal variability in the rate of warming, with several
periods exhibiting weaker trends (including the warming hiatus since
1998) (Figure TS.1). The rate of warming over the past 15 years (1998–
2012; 0.05 [–0.05 to +0.15] °C per decade) is smaller than the trend
since 1951 (1951–2012; 0.12[0.08 to 0.14] °C per decade). Trends for
short periods are uncertain and very sensitive to the start and end
years. For example, trends for 15-year periods starting in 1995, 1996,
and 1997 are 0.13 [0.02 to 0.24] °C per decade, 0.14 [0.03 to 0.24]
°C per decade and 0.07 [–0.02 to 0.18] °C per decade, respectively.
Several independently analysed data records of global and regional
land surface air temperature obtained from station observations are
in broad agreement that land surface air temperatures have increased.
Sea surface temperatures (SSTs) have also increased. Intercomparisons
of new SST data records obtained by different measurement methods,
including satellite data, have resulted in better understanding of errors
and biases in the records. {2.4.1–2.4.3; Box 9.2}"
By their definition, the rate of warming is positive but reduced over a 15 year period 1998-2012. But, by the definition of most or all climate science denialist, the "hiatus" is either cooling or no warming. For example, quoting Anthony Watts, from earlier this month, "The Earth’s temperature has “plateaued” and there has been no global warming for at least the last 18 years, says Dr. John Christy, professor of atmospheric science and director of the Earth System Science Center (ESSC) at the University of Alabama/Huntsville. “"
In my quick study above, I gave a 0.1 (out of just over 0.6) slope or less the denialist attribute of hiatus.
Ah, yes, it does indeed mention hiatus far more often than I thought. Searching the PDF file found zero, then one, and now several. I can't explain that.
Nonetheless, the point is the same, in reference to how climate deniers use the term, and that is what I'm talking about here. See Watts quote above.
Now, if you'd like to argue that the "Hiatus" of the last 17 years is NOT zero warming, but rather, is actual demonstrable warming and that is included in the "hiatus" then fine, I'll by that. A slow down that is within the normal range of variation, much of which is caused by ENSO effects, is what we see. But I'm pretty sure climate science denialists are not likely to admit that.
PDF search seems to be settling on 53 mentions of hiatus.
Pg 61:
"Climate Models and the Hiatus in Global Mean Surface Warming of the Past 15 Years
The observed GMST has shown a much smaller increasing linear trend over the past 15 years than over the past 30 to 60 years (Box
TS.3, Figure 1a, c). Depending on the observational data set, the GMST trend over 1998–2012 is estimated to be around one third to
one half of the trend over 1951–2012. For example, in HadCRUT4 the trend is 0.04°C per decade over 1998–2012, compared to 0.11°C
per decade over 1951–2012. The reduction in observed GMST trend is most marked in NH winter. Even with this ‘hiatus’ in GMST trend,
the decade of the 2000s has been the warmest in the instrumental record of GMST. Nevertheless, the occurrence of the hiatus in GMST
trend during the past 15 years raises the two related questions of what has caused it and whether climate models are able to reproduce
it. {2.4.3, 9.4.1; Box 9.2; Table 2.7}"
That is not the hiatus the denialists are looking for.
They will change the definition to suit their circumstances, denialists being masters of cognitive dissonance. As soon as anyone uses the term "hiatus" by any definition, denialists will take that as meaning whatever definition they want for "hiatus".
It is a "hiatus", not a "pause". It always was a pity that many articles used the term "pause" - it makes it sound like it has stopped. I like Michael Mann's term for it - the "faux pause"
PS that AR5 report PDF doco is large and complex - my computer struggled with it and kept freezing. Probably that mucks up the word search function as well. I found downloading to disk then opening it worked better than reading it from an internet browser.
AH! come on guys!!! We know there is no global warming as the data for it comes from NASA and we know they lie, just look at the myth of the moon landing!!! How can you really trust that data???
Good point about the fake moon landing.