
There are two new scientific research papers looking at variation over the last century or so in global warming. One paper looks at the march of annual estimates of global surface temperature (air over the land plus sea surface, not ocean), and applies a well established statistical technique to ask the question: Was there a pause in global warming some time over the last couple of decades, as claimed by some?
The answer is, no, there wasn’t.
The paper is open access, is very clearly written so it speaks for itself, and is available here. One of the authors has a blog post here, in German.
The other paper looks at the so called global warming “pause” and interrogates the available data to see if the pause is supported. It concludes that it isn’t. The paper is written up in a blog post by one of the authors, here.
I’ll give you an overview of the findings below, but first, a word from the world of How Science Works.
It’s the variation, stupid
No, I’m not calling you stupid. Probably. I’m just paraphrasing Bill Clinton to underscore the importance of variation in science. The new paper examines variation in the global surface temperature record, so this is an opportunity to make this point.
Much of the time, science is about measuring, understanding, explaining, and predicting variation. This is a point non-scientists would do well to grasp. One of the reasons non-scientists, especially those engaged in policy making (from voter to member of Congress to regulatory agent to talking head) need to understand this better is because variation is one of the most useful tools in the denier tool kit. If your objective is to deny or obfuscate science, variation is there to help you.
Global warming, the increase in the Earth’s surface and ocean temperatures caused by the human caused increase in greenhouse gas, is a system with plenty of variation. The sources of variation are myriad, and the result is that the measurement of air temperature, sea surface temperature, and deeper ocean temperature appears as a set of squiggly lines.
In many systems, variation exists at more than one scale.
So, at the centennial scale, we see global surface temperatures not varying much century by century for a thousand years, then the 20th century average is higher than the previous centuries, and the 21st century average, estimated by 15% of the years of a century, is higher still. That is the effect of industrialization, where we shift from using energy from human and animal work, together with a bit of wind and water power, to using energy stored in carbon bonds in fossil fuels. This combined with population increase and increasing demands to support a consumer-driven comfort-based lifestyle have caused us to release fossil carbon into the atmosphere at an alarming rate.
At the decadal scale, we see a few recent decades that stick up above the others, and a few that are lower than others or at least don’t go up as much as others. Over the last 100 years, the decadal average temperatures have gone up on average, but with variation. The primary explanation for this variation is two fold. First, there is an increase in the absolute amount of greenhouse gas, and the rate at which we are adding greenhouse gasses to the atmosphere, so over time, greenhouse gasses have become the main determinant of temperature change (causing an increase). Earlier on, when greenhouse gas concentration was lower, other factors had a bigger impact. The second (and related) explanation is variation in aerosols, aka dust, in the atmosphere from various industrial processes, volcanoes, and such. Decadal or multidecadal variation over the last century has been mainly caused by aerosols, but with this effect diminishing in its importance as it gives way to the increasingly important role of greenhouse gas.
At a finer scale, of a year or a few years, we see variation caused mainly by the interaction of the surface (the air and the sea surface) and the upper ocean (this is sometimes examined for the top, say, 700 meters, other times, for the top 2000 meters, etc.) When we look at just ocean temperatures or just surface temperatures, we see a lot of squiggling up and down on an ever increasing upward trend. When we look at both together, we note that the squiggles cancel out to some extent. The ocean warmed considerably during recent years when the surface warmed more slowly. This is because heat is being exchanged back and forth between the surface and the deeper sea in a away that itself varies.
That is the simple version. In reality things are more complex. Even though ocean and surface temperatures vary from year to year, with the major variations caused by El Nino and La Nina events in the ENSO cycle, there are longer term variations in how this exchange of heat trends. This time scale is in the order of several decades going in one direction, several decades going in the other direction. (see this post) Then, this sort of variation may have much larger scales of change, at century or even millennial time scales, as ocean currents that facilitate this exchange, undergo major changes, which in turn alters the interaction of the surface and the sea. And, of course, both sea and ocean temperature can affect the major ocean currents, so there is a complex causal interaction going in both directions between those two sources of variation.
This is not a digression but it is annoying
Have you ever been annoyed by someone who makes a claim about the health benefits, or negative effects, of some kind of food or other ingestible substance? You know, one of those totally non-scientific “findings” from the usual internet sources. Here is a little trick you can do if you want to challenge such a claim.
In order to truly evaluate a health related claim, and have that evaluation be credible, you have to be able to do one of the following things, depending on the claim. Being able to do this is not enough to validate your expertise, but it is a starting point. It is a gate-keeper thought experiment. If you can’t do this, then you can’t really make the claim you are making with any credibility.
-
Name all the parts of a cell and what they do (for many health claims, especially those that have to do with diet, energy, metabolism, etc.)
-
Name all the different components of the immune system and explain how they work in detail (for many disease or illness related claims).
-
Describe, in detail, the digestive process, i.e., the process of food sitting on a plate being ingested and eventually being used by a human body, at the molecular level (for many claims about the beneficial or negative effects of certain foods, or the benefits of various dietary supplements).
You might be a climate scientist if …
All that stuff I said above about variation is the very simple version of what happens in the climate with respect to global surface temperature imbalance and global warming. If you read what I wrote and the whole time were thinking things like “yeah, but, he’s totally glossing this” or “no, it isn’t that simple, what really happens is…” then you might be a climate scientist.
If, on the other hand, this extensive tl;dr yammering on variation seemed senseless or a waste of time, or you didn’t find it interesting or don’t get the point, the you may not be prepared to evaluate claims like the one about the so-called “pause” or “hiatus” in global warming. More importantly, there is a good chance that a person making the claim that there has been such a pause is unprepared to do so, just as the person claiming that wearing a $50 fragment of a discarded circuit board around their neck will protect them from EMF can not really make that claim because they are a total dumb-ass when it comes to energy fields and cell biology.
Or, the person making the claim (most common in the area of global warming) is just trying to fool somebody. They are like the person who sells the fragment of the discarded circuit board.
Change Point
The first paper is “Change Points of Global Temperature” by Niamh Cahill, Stefan Rahmstorf and Andrew Parnell, published in IOP Science Environmental Research Letters.
A long series of data may demonstrate the outcome of a set of variables where all the variables act in similar ways over time, and any trend plus or minus variation will be clear. But if the variables change in their level of effect over time, it may be that parts of the long term data series need to be treated separately. This requirement has led to the development of a number of statistical techniques to break a series of data up into different segments, with each segment having a different statistical model applied to it.
The statistical approaches to this problem initially arose in an effort to better understand variation in the process of making key electronic components in the telecommunications industry. An early method was the “Control Chart” developed by Walter A. Shewhart at Bell Labs. The method allowed engineers to isolate moments in time when a source of variation contributing to mechanical failure changed, perhaps because some new factor came into play.
More recently, the statistical method of “Change Point Analysis” was developed to provide a better statistical framework for identifying and assessing the statistical significance of changes in sources of variation. The process involves determining whether or not a change in the sources of variation has occurred, and also, estimating if multiple change points have occurred. The process is pretty complicated, numerically, but is automated by a number of available statistical tools.
The new paper attempts to assess the reality of a “pause” or “hiatus” in global surface temperature increase using change point analysis. The change point analysis used four of the major commonly used data sets reflecting surface temperature changes. In each case, they found three change points to be sufficient to explain the medium to long term variation in the data. Most importantly, the most recent detectable change point was in the 1970s, after which there is no detectable change in the trend of increasing global temperature.
The results of the analysis are summarized in this graphic:
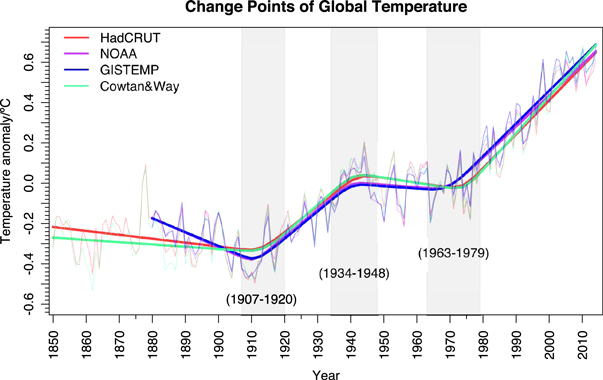
Figure 1. Overlaid on the raw data are the mean curves predicted by the three CP model. The grey time intervals display the total range of the 95% confidence limits for each CP. The average rates of rise per decade for the three latter periods are 0.13 ± 0.04 °C, −0.03 ± 0.04 °C and 0.17 ± 0.03 °C for HadCRUT, 0.14 ± 0.03 °C, −0.01 ± 0.04 °C and 0.15 ± 0.02 °C for NOAA, 0.15 ± 0.05 °C, −0.03 ± 0.04 °C and 0.18 ± 0.03 °C for Cowtan and Way and 0.14 ± 0.04 °C, −0.01 ± 0.04 °C and 0.16 ± 0.02 °C for GISTEMP.
Those who claim that there was a pause in global warming point to certain dates as the origin of that pause. The authors tested that idea by forcing the change point analysis to assume that this was correct. The alleged starting points for a global warming hiatus failed the statistical test. They are not real. The authors determined that the change point analysis “…provides strong evidence that there has been no detectable trend change in any of the global temperature records either in 1998 or 2001, or indeed any time since 1980. Note that performing the CP analysis on the global temperature records excluding the 2013 and 2014 observations does not alter this conclusion.”
In addition, even though the alleged starting points for a global warming hiatus were found to be bogus, they were found to be more bogus in one of the four data sets, that developed by Cowtan and Way, which in turn is generally thought to be the data set that eliminates most of the biases and other problems found in this sort of information. In other words, using the best representation available of global surface temperature increase, the so called hiatus is not only statistically insignificant, it is even less significant!
But that wasn’t enough. The authors took it even a step further.
Finally to conclusively answer the question of whether there has been a ‘pause’ or ‘hiatus’ we need to ask: If there really was zero-trend since 1998, would the short length of the series since this time be sufficient to detect a CP? To answer this, we took the GISTEMP global record and assumed a hypothetical climate in which temperatures have zero trend since 1998. The estimated trend line value for 1998 is 0.43 °C (obtained by running the CP analysis on the original data up to and including 1998). Using this, we simulated 100 de-trended realizations for the period 1998–2014 that were centered around 0.43 °C. We augmented the GISTEMP data with each hypothetical climate realization and ran the four CP model on the augmented data sets. This allowed us to observe how often a fourth CP could be detected if the underlying trend for this period was in fact zero. Results showed that 92% of the time the four CP model converged to indicate CPs in approximately 1912, 1940, 1970 and a fourth CP after 1998. Thus, we can be confident that if a significant ‘pause’ or ‘hiatus’ in global temperature did exist, our models would have picked up the trend change with a high probability of 0.92.
 Climate change deniers are always trying to make the graphs go down. The graphs do not cooperate.
One is forced, sadly, to think about what deniers might say about any new climate change study. In this case, I think I know what they might say. Look again at the graph shown above. We see two periods when temperatures seem to be going down, and two periods when temperatures seem to be going up. So, half the time, they are going down and half the time they are going up, right? So, what happens if, as suggested by some climate deniers, we are due for a downward trend? Maybe there will be enough multi-decadal downward trends over the next century or so to significantly attenuate the overall trend. Hey, we might even see cooling. Right?
Well, no. For one thing, as mentioned above, the overall pattern has been an increase in the importance of greenhouse gasses as the variable controlling surface temperatures. Whatever factors caused the flattish or downward trends many decades ago may still be in place but are relatively less important from now on, even if we quickly curtail CO2 output. Also, one of those factors, aerosols, is reduced permanently (we hope). Industrial pollution, in the past, caused a lot of aerosols to be released into the atmosphere. This has been reduced by changing how we burn things, so that source attenuation of surface temperatures is reduced. Also, as noted above, there are multi-decadal changes in the relationship between the surface (air and sea surface) and the ocean, and at least one major study suggests that over coming decades this will shift into a new phase with more surface heating.
I asked author Stefan Rahmstorf to comment on the possibility of a future "hiatus." He told me that one is possible, but "I don't expect that a grand solar minimum alone could do it (see Feulner and Rahmstorf ERL 2010). Maybe an exceptionally large volcanic eruption could do it but it would have to be far bigger than Pinatubo, which did not cause one." He also notes that some IPCC climate models have suggested a future slowdown, and the possibility of cooling in not non-zero. The key point, he notes, is "it just has not happened thus far, as the data analysis shows."
Author Andrew Parnell noted, "I think anybody who claims that these current data demonstrate a hiatus is mistaken."
Think there is a global warming hiatus? Slow down a second…
The second paper is “Lack of evidence for a slowdown in global temperature” by Grant Foster and John Abraham. Foster and Abraham start out by noting that there is a widely held belief, even among the climate science community, “…that the warming rate of global surface temperature has
exhibited a slowdown over the last decade to decade and a half.” They examine this idea “…and find no evidence to support claims of a slowdown in the trend.”
The authors note that most of the discussion of global warming involves reference to “ the relatively small thermal reservoir of the lower atmosphere” (what I refer to above as the “surface”), but since this is only a small part of the planets heat storage, this can be misleading. When the ocean is taken into account, we see no slowdown in warming. The paper by Foster and Abraham refers to the above discussed paper on change point analysis, so I’ll skip that part. The remaining thrust of the paper is to apply some basic statistical tests to the temperature curves to see if there is a statistically valid slowdown.
They derived residuals, using the GISS data set, for the last several decades, indidating the divergence of each year from an expected value given an upward trend. This looks like this:
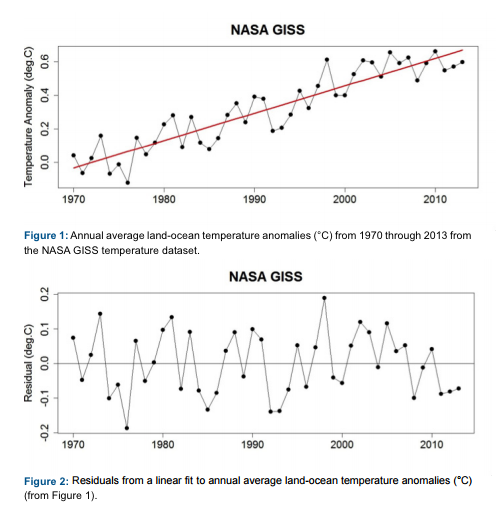
They then took sets of adjoining residuals, and tested the hypothesis “This set of numbers is different from the other numbers.” If there was a statistically significant decrease, or increase, in temperature change for several years it would show up in this analysis. The statistical test of this hypothesis failed. As beautiful as a pause in global warming may seem, the idea has been killed by the ugly fact of ever increasing temperatures. To coin a phrase.
Then…
As a last attempt to find evidence of a trend in the residuals, we allowed for models in which not only the slope (the warming rate) changes, but the actual value itself. These are discontinuous trends, which really do not make sense physically … but because our goal is to investigate as many possible changes as is practical, we applied these models too. This is yet another version of change-point analysis, in which we test all practical values of the time at which the slope and value of the time series change. Hence it too must be adjusted for multiple trials.
Again, no statistical significance. If you look at the global temperature curve, and see a pause, what you are really seeing is noise.
Foster and Abraham conclude:
Our results show that the widespread acceptance of the idea of a recent slowdown in the increase of global average surface temperature is not supported by analytical evidence. We suggest two possible contributors to this. First, the natural curiosity of honest scientists strongly motivates them to investigate issues which appear to be meaningful even before such evidence arrives (which is a very good thing). Second, those who deny that manmade global warming is a danger have actively engaged in a public campaign to proclaim not just a slowdown in surface temperature increase, but a complete halt to global warming. Their efforts have been pervasive, so that in spite of lack of evidence to back up such claims, they have effectively sown the seeds of doubt in the public, the community of journalists, and even elected officials.
Minor point; is that Grant Foster, the noted statistician?
('t' instead of 'd', although maybe grand applies as well.)
Yes, indeed, he is a grand statistician!
Someone should tell these guys we're living in an interglacial and that Glowbull warming won't stop until just before the next ice age begins.
Earthling, there has not been a Pleistocene "Ice Age" with more than something close to 250ppm CO2. We are at 400. There won't be another ice age with this CO2 level.
Earthling, if you study interglacial temperature records you'll find that the high point is reached early, after which comes a slow decline and finally a steep decline into the next ice age. I challenge you to find an interglacial with a secondary peak such as we're currently experiencing.
Earthling.
Sure, we are in an interglacial. But what is your scientific evidence that global warming naturally occurs during an interglacial?
I think you are thinking of the termination of the last glacial period - global warming did occur at this point.
Not in the least bit surprised but still nice to have yet another strong confirmation of reality on this point. Time we all collectively faced up to it and stopped the denial.
@3. Earthling - witha small 'e'
Someone(you?) should tell who what why now?
I reckon they guessing the mean the climate experts here probably know a wee bit more that ice age versus hothouse climate point there than you do earthling. heck, they may even know how you spell the word global and what that word means. Among so much more.
I scent troll and it smells stale, rancid and like sour bodily wastes.
But do feel free to prove me wrong earthling by making an actual new, logical argument and point supported with real evidence and actual science if you can.
#8... Was that a voice recognition transcription?
Meh, culture warriors. 'Glowbull'. Yet another not-so-clever buzz word from the willfully ignorant howler monkeys who brought you this towering pinnacle of scientific reasoning: "Al Gore is fat."
They're not interested in getting themselves right on the issue. They're only interested in getting self-righteous on your ass.
I think it's that "they're only interested in getting self-serving on themselves".
"Damn the consequences! I want mine, now! Don't anyone tell me that I have to change my lifestyle to prevent some kind of disaster!!"
Very childish.
Earthling (ironic name in this context, in a few different ways:
Which do you think is more likely? - 1) These professional scientists, trained extensively in this topic, who spend every day of their professional lives researching it in detail, have just failed to notice this obvious and widely available fact. 2) This topic is considerably more complex than your layman's grasp of it, these researchers know a lot of things about it that you don't, and you'll have to do more digging, with a little more humility, if you want to understand what they're saying and be a reasonable judge of their reliability.
Your Occam's Razor wants sharpening.
Earth to earthling,
take your protein pills and put your helmet on.
Your circuit's dead,
there's something wrong...
The graph label says "Last 30 years." If that is the case, then we don't have to worry about climate change.
@10. Brainstorms : "#8… Was that a voice recognition transcription?"
No, I just suck at typing.
In a totally related point, I really wish we could edit our comments here - even if just for a five- to -15 minute window like on some blogs so I could get rid of the worst of my typographical, grammatical and other bloopers. Which I usually catch just after I've clicked that "submit comment' button - mea culpa.
#16: Well, it sure didn't sound like your usual careful prose...
I agree that it would be nice to be able to edit one's comments.
I also wish for a comment editing button.
Earth's temperature is determined, largely, by solar activity from our star. As far as CO2 emissions go, much more is supplied by volcanic activity, than all the world's pollution combined, but, let's not confuse the issue with any real facts...
[Both of these statements are simply wrong. Now you know! -gtl]
No.
No.
"...let’s not confuse the issue with any real facts"
Nobody can accuse you of doing that.
JosephW, feel free to supply any links to credible sources backing up your two assertions.
Here are a couple for you:
A Professor of Astrophysics at the University of Barcelona explains how greenhouse gases in the atmosphere largely determine Earth's temperature:
http://www.am.ub.edu/~jmiralda/fsgw/lect3.html
Interview with two independent volcanologists - scientists who actually study volcanoes - who agree that humans emit at least 100 times the amount of CO2 that volcanoes do, every year:
http://news.discovery.com/earth/weather-extreme-events/volcanoes-co2-pe…
I found each of those with a minute or so of searching, tops. What have you got?
A fine web page: thank you. The fact that atmospheric CO2 is the chief temperature control of Earth has been "took boxed" by scientists for decades; celestial mechanics (solar isolation, etc.) determines the direction the "thermostat" is turned (warmer or cooler), but it is greenhouse gases that set the temperature itself--- demonstrated by C.J. Fox in 1909, A. Angstron in 1918, and Chamberlain and Fowle in 1916, 1917, and 1918 (among many others).
Oh, my pleasure. Fine ancient citations there - thank YOU. The level of willful blindness necessary for so many people to believe that Al Gore and/or environmental activists invented global warming theory in the '70s would be amazing if I weren't used to it by now.
@20. JosephW : You are entitled to your own opinion but not your own facts. The two things you asserted are Points Refuted A Thousand Times. (PRATTs.)
On the solar issue see :
https://www.youtube.com/watch?v=_Sf_UIQYc20&list=PL029130BFDC78FA33&ind…
Or just consider the temperature and climate ranges of our Moon and how it compares to ours.
On the volcanos thing, see :
https://www.youtube.com/watch?v=boj9ccV9htk&index=80&list=PL029130BFDC7…
Especially the 50 second to one minute thirty seconds section. The rest of that Peter Sinclair Youtube series is excellent and also one I'd highly recommend. Potholer 54's series on this also on youtube is another great one I'd suggest you watch and learn form too.
I'd also suggest before making any further coments spouting PRATTs you check the list of debunked Denier arguments here :
http://www.skepticalscience.com/argument.php
Seriously. Please educate yourself and think more deeply on this topic. It matters.
@ #21
The sun warms our planet. Global warming is a condition where warmth from the earth, caused by the sun, cannot escape our atmosphere. Given that CO2, is more prevalent, it is labeled as the 'guilty party' in GW. Methane, however, pound for pound is 22X more GW than CO2 at trapping heat (greenhouse effect) http://www.thinkglobalgreen.org/METHANE.html - even though CH4 + 2O2 -> CO2 + H2O + H2O. Methane releases from natural gas and petroleum processes constitute about 37% of emissions, compared with 8% from manure and 5% from 'other' sources such as ice storage and bio-emissions. http://ens-newswire.com/2012/12/12/states-threaten-epa-over-petroleum-i…
So many other factors are not being addressed, such as ozone (O3) depletion, deforestation, and massive phytoplankton kill, that are contributing to the reduction of O2 production and allowing CO2 increase, paving the way for GW.
Another big factor is ocean temperature (specifically El Nino) causing increase weather disturbances and climate changes, especially present in the Indian Ocean.
http://www.techtimes.com/articles/67741/20150711/nasa-says-global-warmi…
http://journals.ametsoc.org/doi/abs/10.1175/JCLI-D-14-00471.1
The very facts are, most of this science is conjecture, hypothesis and theory. We have to realize there is not one source for GW, but many factors (including man-made and geophysical) that are adding to this problem.
Imposing a tax on the North American general public for carbon emissions does not and will not solve the problem - not I think those who receive these taxes would do anything(or could) to correct the issue with it anyways.
@#24
Michael, credible sources once placed our planet at the center of our solar system and had shown it to be flat.
@#28
Brian, no, it is not clear, nor is the power used by your AC unit responsible for the temperature, rather, it is the compressed gas circulated through metal tubes with fan blowing across, responsible for the cooling effect. Not to mention, I don't see how your analogy is related nor pertinent.
Give me data from ANY study and I can relate it ANY way(pro, neutral, or con) I choose.
JosephW
My air conditioner uses about 100kwh a month. The AA battery in the thermostat can deliver about 2.6 watt hours, and lasts about a year. Clearly my house's temperature is determined, largely by electricity from Duke Power, so the system would cool just the same with or without the thermostat battery. Right?
Isotopic evidence of magmatism and seawater bicarbonate removal at the Endeavour hydrothermal system; G. Proskurowski, M.D. Lilleya, T.A. Brown; Earth and Planetary Science Letters,Volume 225, Issues 1–2, 30 August 2004, Pages 53–61; http://www.sciencedirect.com/science/article/pii/S0012821X0400384X
"Stable and radiocarbon isotope measurements made on CO2 from high temperature hydrothermal vents on the Endeavour Segment of the Juan de Fuca Ridge indicate a magmatic source of carbon to the hydrothermal system after a 1999 earthquake. The radiocarbon measurements require that a large fraction of seawater bicarbonate originally present in the downwelled fluid be removed during hydrothermal circulation."
The calcium, magnesium, sodium, potassium and iron aluminosilicate (feldspar) components in Mid Ocean Ridge Basalts react with CO2 in the presence of water to give carbonates and silica + aluminum silicate clays; the Ca,Mg silicate (peridotite), and Ca,Fe silicate (olivine) components undergo similar reactions. The 85000 kilometer ocean ridge volcanic mountain chain is a net sink, not source, of CO2. The Hawaiian islands erupt about 0.085 cubic kilometers of basalt per year, containing about 10 percent calcium. At 3 tons per m^3, this is enough calcium to sequester about 8 times the 0.0031 gigatons of CO2 emitted per annum.
Brian Dodge - Nice metaphor.
I expect JosephW will handily refute all of this information and argument by noting that these scientists are all leftists and/or on the government payroll, Q.E.D.
@#29
I take all reported information the same way...with a grain of salt - understandably and typically, leaning towards the general consensus of those who are funding.
It is no secret that the truly beneficial breakthroughs in science achievement and advancement of mankind have been suppressed because of low profit margins and/or population mindset control.
I also take offense at your placement and/or labeling of my mindset. Please do not presume to think you can predict my retorts or read my mind.
Thank you.
"Give me data from ANY study and I can relate it ANY way(pro, neutral, or con) I choose."
And no doubt you do.
"Show me six lines written by the most honest man in the world, and I will find enough therein to hang him."
~ Cardinal Richelieu
Exactly.
Numbers never lie, only man and his manipulation of them.
In science, manipulated data are almost never "lies." If you can spot any climatologists or other scientists "lying" when they manipulate data, do be sure to complain then.
-"Michael, credible sources once placed our planet at the center of our solar system and had shown it to be flat."
Wow, straight to the old "people once believed wrong things, therefore I can dismiss anything anyone believes now" gambit. Truly, you have a dizzying intellect.
-"So many other factors are not being addressed..."
As some of *your own links* show, climate scientists are quite aware of these factors, study them every day, and take them into account in their hypotheses on climate change.
-"Imposing a tax on the North American general public ."
You mean on polluting industries. And we all get taxed for that pollution down the line anyway, in the economic and social blowback from the consequences of warming - a carbon tax puts the onus on the source of the problem.
-"... does not and will not solve the problem."
Got an argument for that? Or just an assertion?
-"not I think those who receive these taxes would do anything(or could) to correct the issue with it anyways."
Got an argument for that? Or just a boilerplate "government is the problem not the solution" libertarian assertion?
-"Give me data from ANY study and I can relate it ANY way(pro, neutral, or con) I choose."
Maybe *you* can. It's called cherrypicking, and it's perfectly commonplace among pseudoscientific fringe thinkers. The scientists who actually study these things are bound by a number of factors to be more rigorous, and almost all of them disagree with your assertions. Why should anyone listen to you?
@#32
'You mean on polluting industries.'
Since when did general public become polluting industries?
I never suggested there wasn't a problem with global warming, merely pointed out recognized factors which are causing this event are colossal and incorporate many circles of science, not just CO2 emissions. Taxing corporate offenders of pollution has proven already to be fruitless as they are given 'acceptable' amounts allotted, to which they merely sell unused amounts to other offenders- no to mention most times they are tax exempt.
'Got an argument for that? Or just a boilerplate “government is the problem not the solution” libertarian assertion?'
Endless supply of arguments for that tbh. Every government is good at one thing, taking money. None of them are good at (or qualified to) do any service. Which government paves roads, educates, moves energy to the masses, or any other social program? These are all handled by companies and professionals financially rewarded by funding, supplied by tax payer's money. Tax money is better left to the public to grow business and communities. Scrap the programs and shrink the government. Move away of social benefits (which aren't benefiting society) and work on development of self sustaining public. Most of the money is wasted on war, mega corps bailouts, ridiculous programs (like bio-genetic engineering), secret programs and the many other non-voted for agendas used to waste these monies. Government isn't the problem, but is certainly a factor.
'Wow, straight to the old “people once believed wrong things, therefore I can dismiss anything anyone believes now” gambit'
If you hadn't noticed, a very large percentage of scientists are aged, and jumping to the extreme conclusion of my statement, made to prove the point, that 'credibility' is given to a general acceptance of the masses of learned minds of the times, is a pathetic attempt to discredit. We are NOT smart, as a collective, especially when it comes to the ignorance of thinking, the masses have little worthy contribution to the well being of the planet as a whole. Greed, power, and lust for humanity's control will always stifle scientific achievement and twist it into forms of destruction.
'Maybe *you* can. It’s called cherrypicking, and it’s perfectly commonplace among pseudoscientific fringe thinkers.'
I said I can, not I do. Again, your inference is used only to mislead the ignorant and discredit my statement, performed poorly in my humble opinion, while attempting to make yourself feel better or smarter.
'Why should anyone listen to you?'
I was thinking the same thing for your arguments. :)
And now that I think about it, what was the point of your "it's the sun" remark in your original #20 post, when you then go on to talk at length about greenhouse gases in a later comment? You can't even keep your own talking points straight or follow the internal logic of your own arguments. No wonder science (or a simple analogy like Brian's) confuses you so.
@#33
Being you are likely science based, it's no wonder you have problems with English.
Good thing you are sitting down, I imagine the brain strain was a little much for you.
You cannot refute my valid point it's the SUN that warms the earth, and if you peruse my original post again, you will discover, I made no reference to global warming(GW only adding to the average temperature of the earth, not the daily change of warmth), so perhaps, it is you who cannot follow other people's talking points.
As far as Brian's analogy goes, an air conditioning unit employs NONE of the factors being discussed, nor does it relate and is, in fact, exactly opposite of warming effect.
Also, I have little problem with science itself, merely the ignorance of so many who employ it and think they know it all.
Er... ah... um, who ever claimed otherwise?
For those interested in comparisons of interglacials, ours, The Holocene,) differs greatly from past ones, as seen in CO2/CH4 from ice cores. See Ruddiman, etal(2011), esp Figs 2 and 6.
"nor is the power used by your AC unit responsible for the temperature, rather, it is the compressed gas circulated through metal tubes with fan blowing across, responsible for the cooling effect."
Does the refridgerant gas get compressed by magic?. Does the air flow across the coils, removing the heat and causing the hot gas to cool and condense to a fluid, happen by an act of will? When the liquid refridgerant flows through a capillary tube or expansion valve to a low pressure coil, where it boils, absorbing latent heat of evaporation, is the low pressure maintained by Republicans acting to change reality, or does it require electricity from Duke Power to compress the gas? Is the heat given off by the condensor more or less than absorbed by the evaporator? Does this heat magically disappear?
"As far as Brian’s analogy goes, an air conditioning unit employs NONE of the factors being discussed, nor does it relate and is, in fact, exactly opposite of warming effect."
You might want to study how differences between the moist and dry adiabatic lapse rate are related to latent heat of evaporation, its effect on climate, and how the sinking part of Hadley circulation, or foehn winds cause hot, dry weather conditions like are found in the American Southwest. If I had described my air conditioner as a heat pump warming the house in winter, would you have better understood? Do you think the physics changes between "heat pump" (pumping heat from outside to inside) and "air conditioning"(pumping heat from inside to outside) mode?
"Given that CO2, is more prevalent, it is labeled as the ‘guilty party’ in GW. Methane, however, pound for pound is 22X more GW than CO2 at trapping heat (greenhouse effect)" But given that CO2 is 400ppm but methane is less than 2ppm, it's much less of a problem currently. If the clathrate gun bullet holes - http://siberiantimes.com/science/casestudy/news/n0127-dozens-of-mysteri… - continue to grow exponentially, that will change.
"Earth’s temperature is determined, largely, by solar activity from our star." "The sun warms our planet." These are not equivalent statements. The sun warms our planet, and my air conditioner cools my house in summer(and in "heat pump" mode, with the cycle reversed, heats it); the thermostat determines the temperature, and CO2, with amplification from water vapor and cryosphere albedo feedbacks controls the earth's temperature - much like a thermostat.
" Taxing corporate offenders of pollution has proven already to be fruitless as they are given ‘acceptable’ amounts allotted, to which they merely sell unused amounts to other offenders-" I think you're conflating taxation with cap and trade. Cap and trade regulations worked well to reduce SO2 emissions from power plants and other industrial coal fired plants - and it was conceived by Reagan, delivered by Bush Sr. and praised by Bush Jr. They employed such a system to phase out lead in gasoline, cut chlorofluorocarbons and other ozone-depleting chemicals, and reduce sulfur pollution from power plants responsible for acid rain, all without undue cost. Not exactly "fruitless" endeavors
"Which government paves roads, educates, moves energy to the masses, or any other social program?" Nebraska DOR paves its own roads - there's a Dirty Jobs segment where Mike joins a crew of state employees paving a section of road. Michael Mann got his AB in applied math&physics from University of California Berkeley, and has been on the faculty of the University of Virginia and Pennsylvania State University. And there are the examples of the Tennessee Valley Authority and Social Security Administration.
Studies of the global mean surface temperature trend are typically conducted at a single (usually annual or decadal) time scale. The used scale does not necessarily correspond to the intrinsic scales of the natural temperature variability. This scale mismatch complicates the separation of externally forced temperature trends from natural temperature fluctuations. The hiatus of global warming since 1999 has been claimed to show that human activities play only a minor role in global warming. Most likely this claim is wrong due to the inadequate consideration of the scale-dependency in the global surface temperature (GST) evolution. Here we show that the variability and trend of the global mean surface temperature anomalies (GSTA) from January 1850 to December 2013, which incorporate both land and sea surface data, is scale-dependent and that the recent hiatus of global warming is mainly related to natural long-term oscillations. These results provide a possible explanation of the recent hiatus of global warming and suggest that the hiatus is only temporary
Okay, I give up: what "hiatus?"