
Human caused climate change is changing the size and location of major climate zones, according to a new study.
Climate is complex, and a classic, widely used effort to wrangle that complexity into a sensible form is the Köppen classification system (and variants). We need not speak of the details here, but within this scheme there are five climate groups that include all of the possibilities for the Earth’s land surface. They are:
- A: Tropical/megathermal climates
- B: Dry (arid and semiarid) climates
- C: Temperate/mesothermal climates
- D: Continental/microthermal climates
- E: Polar and alpine climates
This is sort of like a large scale version of the famous planting zone classification you use to determine when to plant your radishes or take in the last of the green tomatoes. The classifications are based on the idea that plants are indicators of the complex mix of factors that determine regional climate. Average temperatures matter, but high and low temperatures, when they occur (during the day and across the march of seasons) matter more, with key values such as frost mattering a lot. Average precipitation matters, but the distribution of precipitation across the year which might result in dry seasons matters a great deal. Ultimately, the local expression of global temperature, moisture, elevation, latitude, and the physical proximity to large bodies of water (most notably the oceans) and mountain ranges result in regional or local climate. The five classifications reflect zones that are mostly distributed across latitude (A on the Equator, E on the Poles) but that are also heavily influenced by altitude.
As humans add greenhouse gasses to the atmosphere the climate changes. We therefore expect these major classifications of regional climate to change as well, both in their relative sizes and in their locations with respect to latitude and altitude.
They do.
A new paper, “Significant anthropogenic-induced changes of climate classes since 1950” by Duo Chan and Qigang Wu, in Nature’s Scientific Reports journal, looks at Köppen classes under global warming, and also attempts to parse out underlying natural variation.
The paper is Open Access so you can go read it yourself. It is very clearly written and interesting. Here, I’ll just give you the key conclusions.
The research uses several data sources to conduct the analysis. All of the data are gridded across the globe, but some grids don’t have their own data because they are in remote areas with little or no instrumentation across the study period. Some data sets interpolate values into these grid squares, and those that do use different methods. One major data set leaves those grid squares blank and treats them as missing data. By using all of the data sets, the researchers were able to avoid coming up with results that were influenced by specific interpolation methods. Most importantly, though, they discovered that using the missing data approach did not change results because the missing data squares are mostly in the most A-like of Group A climate areas or the most E-like of Group E climate areas. Group A climate zones are growing, so being in the middle of those zones does not influence the analysis. So, not knowing what was going on in the middle of the Congo Raiforest does not change anything. Group E climate zones are shrinking, but those areas that are deep wihtin those zones (at the poles, on top of Mount Everest, etc.) don’t matter either.
Group D is “continental” and includes places like Chicago, Seoul, Salt Lake City, Ottawa, Flagstaff, and Faribanks. It is a very large zone that transits places that have real winters and those that have whimpier winters. Even though Group D is huge and significant, it also acts a bit like an ecotone or transition between Group C (Seasonally dry or arid, like Los Angeles, Cape Town, Beirut) and Group E (Tundra, ice caps, etc.). For this reason Group D is divided along the 55th parallel.
There are some complexities in how the data change over time which I will skip here (see the original paper). The point is, the zones do change significantly, with anthropogenic global warming being the primary cause. There is nothing particularly surprising in the results, but details can be important. Most importantly, the study also uses modeling to look at both past and future changes, and predicts an acceleration in change.
This graphic shows changes in climate types over the period 1950 to 2003 using one of the data sets (the data they chose for most of the analysis).
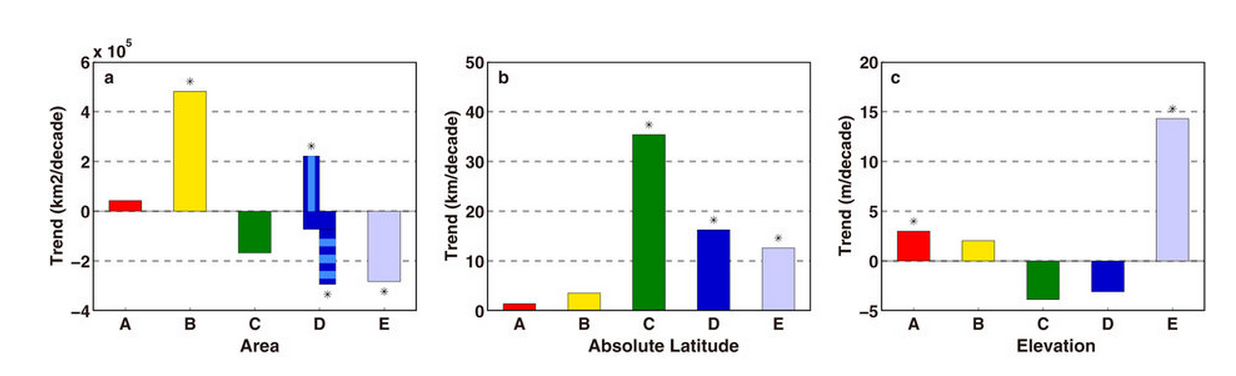 Linear trends in areas of 5 major climate types for 1950–2003
Tropical areas are expanding in space, moving north, and moving up in elevation. Not a lot, but a little. Why not a lot? The study does not say but I’ll guess. The tropical heat and moisture associated with this climate group are rapidly dispersed by air and water circulation systems and become part of the rest of the climate system quickly.
Arid and semi-arid areas (Group B) expand dramatically in area, and also move north and up hill. Why to they expand so much? There are probably two reasons. One is that more heat means more evaporation as well as more holding potential for water in the air. So ground moisture is sucked into the air at a greater rate, and stays there longer. Another (but closely related) reason may be the clumping of moisture we see in certain emerging weather patterns. Clumping means more arid conditions, even if that clumped water all falls eventually, on average, where it might have fallen anyway. A given amount of water falling uniformly in time and space across a region may provide a non-arid climate zone. The same amount of water falling non-uniformly in space, or especially, time, may result in a semi-arid zone.
Arid, semi-arid, subtropical Group B expands at the expense of Group C, while Group C is busy moving north but not up in elevation. The norther parts of Group D (ie, much of Canada) diminishes in area and moves north and uphill.
Group E, the cold bits, decline in area, move north, and retreat uphill.
The most important thing in this graphic is probably the expansion of Group B, where we can and do grow some food but under somewhat difficult conditions, and the loss of Group C area. The breadbasket, it is shrinking.
The paper concludes,
… major Köppen climate types since 1950 have occurred worldwide and are almost entirely attributed to the observed anthropogenic increase in greenhouse gas concentrations. Model runs project accelerating anthropogenic-induced major climate type changes in the next decades. As the Köppen climate classification links the Earth’s climates with the qualitative features of the vegetation, results here indicate that observed climate changes might already be causing significant impacts on vegetation in areas where the major climate class has changed, and model projections imply increasing future impacts.
This is a problem.
.png)
"This is a problem."
Naw, it's not a problem: 800,000,000 people can just pack up and move in to all the free, unoccupied, fertile regions where there's plenty of fresh water and no armies to oppose their migrations.
What? You say there are no such places? Oh, fuck!
Those numbers are profoundly concerning, especially at this relatively early stage in the inescapable warming that we're going to inflict on the planet. Humanity is going to have to resume its seats, buckle up, and engage the brace position.
'Humanity is going to have to resume its seats, buckle up, and engage the brace position.'
I recall a typical meme or 'toon during the cold war...how to survive a nuke blast:
1. resume your seat
2. buckle up
3. engage in the brace position
4. kiss your ass goodbye
HUmans must have some sort of death wish.
The growth of group B becoming more rapid can easily effect the lives of humans and any other species. Having a good mix of climates gives us more area to grow useful crops. Section C, which is around where we live, gives us a great source of food. If the arid climate continues to overtake the temperate area we'll need to find new ways to grow food in an arid climate. Or if arid temperatures only contuinue to push area C north and not completely over take the temperate regions new countries may grow new crops.
The growth of group B becoming more rapid can easily effect the lives of humans and any other species. Having a good mix of climates gives us more area to grow useful crops. Section C, which is around where we live, gives us a great source of food. If the arid climate continues to overtake the temperate area we'll need to find new ways to grow food in an arid climate. Or if arid temperatures only contuinue to push area C north and not completely over take the temperate regions new countries may grow new crops