
Both Hillary Clinton and Bernie Sanders are viable candidates to win the Democratic nomination to run for President of the United States.
There are polls and pundits to which we may refer to make a guess as to who will win. Or, we could ignore all that, and let the process play out and see what happens. But, spreadsheets exist, so it really is impossible to resist the temptation of creating a simplistic spreadsheet model that predicts the outcome.
But we can take that a step further and suggest alternate scenarios, based on available data. So I did that.
I have removed the so called "Super Delegates" from the process. This model assumes that the super delegates will ultimately either divide themselves up to reflect the overall distribution of committed delegates, or will mass towards the apparent leader. In any event, it is important that you know that the term "Super Delegate" is an unofficial made up term. They are really called "Uncommitted Delegates" because they are uncommitted. They will walk into the National Convention with no requirement as to whom they cast their vote for. That is their purpose. Meanwhile, it is true that individual Uncommitted Delegates will "endorse" a candidate during the process. Personally, I'm against this because it leads to conspiratorial ideation among activists and other interested parties. If I was King of the Democratic Party, I would make a rule that if you are going to be an Uncommitted Delegate that you don't endorse or in any other way imply support for a candidate. (I would also probably reduce the total number of Uncommitted Delegates somewhat.)
So, in this model, the number of delegates it takes to be assured the nomination, pragmatically if not fully realistically, is the number required by the process minus the number of Uncommitted Delegates, or 2382-712=1670. In the graphs below, I represent this threshold by a wide blue line to reflect uncertainty. When a candidate's delegate count makes it to the vague blue line first, that is an indicator that this candidate may be anointed. But, if the two candidates are close in delegate count at this point, a proper degree of uncertainty has to be assumed.
This modeling effort explores the effect of ethnicity on the outcome. I assume all voters are White, Black, or Hispanic. I also only look at US states and DC, because things may be very different in the territories and possessions with respect to ethnicity. It is not too hard to estimate the relative preference for either of the two candidates among White, Black, and Hispanic subpopulations. It is probably true that these ethnic divisions work very differently in different areas. For example, union endorsements may affect ethnic voting patterns more or less for different ethnicities in different states. Importantly, it is likely that both preference and turnout will evolve among the ethnic groups as the primary process continues. This, of course, is why we use a spreadsheet. You can change the numbers any time as more information is available.
This model does not involve age directly, but does so indirectly, in that variations in age graded participation factor into ethnicity. Same with sex, or more accurately, sex is divided evenly across the primary states (I assume) while age might not be, so again, it can factor into ethnicity. But a more sophisticated model that looks at turnout differentials or anomalies across age and sex would be better, and if the information related to this becomes available, perhaps I'll update the model.
The Iowa Caucus involved mostly White voters, and told us that Clinton and Sanders are very close to even in this demographic. So, the model could assume a 50-50 spit among White voters. Currently available and fairly recent polling data tell us that Clinton is preferred by African American Democrats and Hispanic Democrats, but to different levels. So, a first stab at this model can use a Clinton-Sanders ratio of 70-30 for African American primary voters, and 60-40 for Hispanic primary voters. Using these three sets of ratios, and known statewide demographics across the primary, we can estimate the effects of ethnicity.
One problem you might note right away is that the statewide ethnicity profiles are not the same as the Democratic Party ethnicity profiles. A better version of this model will use the primary participant profiles instead. But, the last two election cycles of data are probably biased in this regard because of Obama's candidacy, and thus may be incorrect. The preferred method will be to recalculate state by state ethnicity profiles, to estimate how many of each of three groups will vote, based on the returns from the first several primaries. I'll do that. Right now this is impossible because both Iowa and New Hampshire lack the diversity in the voting population to allow it.
I am ignoring the New Hampshire results because I don't know how to adjust for the Favorite Son Effect there. Also, New Hampshire is an odd state when it comes to primaries. The largest voting block, in the New Hampshire Primary, is uncommitted, and they can vote in either primary (but Republican and Democratic voters can not switch). This, and some other factors, has resulted in a special culture among New Hampshire voters. So, between the Favorite Son Effect and the special snowflake nature of New Hampshire (which is what makes New Hampshire so interesting and important, of course) I'm ignoring it for now, but will include data from the Granite State when there are more other states to consider.
So, the first model assumes the above stated numbers, and produces this effect:
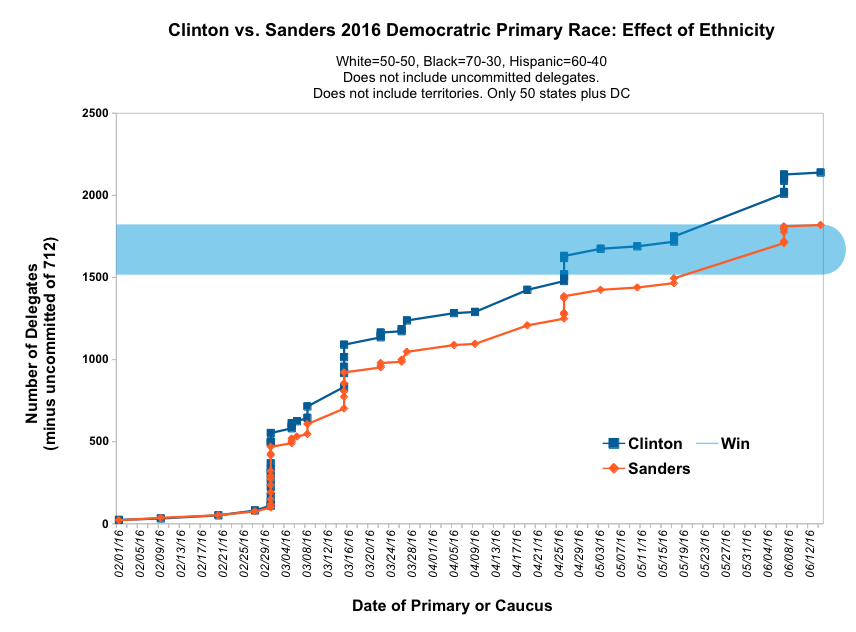
In this model, Clinton wins the primary. The pattern of delegate accumulation is interesting, and is actually one of the main reasons to do this modeling, but it only becomes understandable when compared to other outcomes, so let's look at the alternative model I ran and then compare.
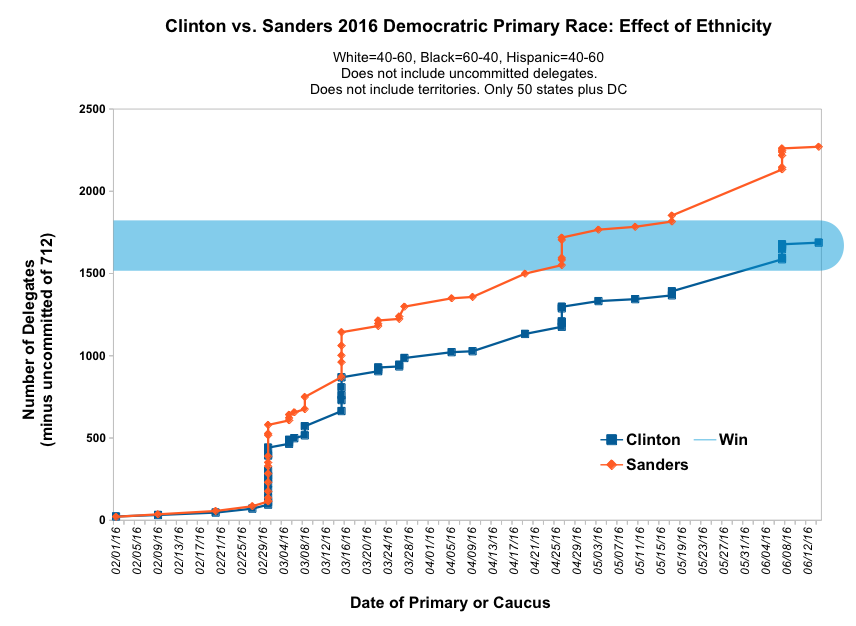
The second model takes a cue from the large number of new young voters combined with their Bernie-ness and their whiteness to suggest a change in the White Ratio to favor Sanders. I sucked on my thumb for a minute and came up with a 40-60 ratio. This model gives credit to Sanders campaign claims that African Americans will grok the Bern, and lowers the differential among Black voters to 60-40. This model assumes something similar for Hispanic voters, and adds another element. It is possible that in some states labor related issues will cause Hispanic votes to shift even more strongly to Sanders, so my thumb-suck estimate for this ratio is 40-60.
The second model is designed to favor Sanders in a way that might reasonably reflect actual possible voting preference shifts that the Sanders' campaign is attempting. So, this model assumes Sanders succeeds where he is clearly trying, and produces this result:
Now, we can compare the two models, which I think are a) reasonable given what we know and b) need to be taken with a grain of salt because of what we don't know.
The two models show a difference in how the spread between the candidates evolves, and when the projected winner can be seen as anointed by the process. In the case of the Clinton win, which assumes the status quo maintained for the entire campaign, and gives credit to the idea that "Sanders can't win in the South" (more or less), the two candidates stay close enough to each other that there will be no clear winner for a long time, even if Clinton actually does stay ahead of Sanders the whole time. In this case, the jump into the blue zone, though not by a very large margin, does not happen until April 26th, when there are several primaries including Pennsylvania, with a massive delegate count. Also, importantly, after this date there are still some very large states including New Jersey and especially California, that could flip a result. If this is the pattern that develops, the day after the big primary day on April 26th, if I was Sanders, I'd camp out in California!
In the case of the Sanders win, the pattern is very different. (This is why this is interesting.) Here, Sanders pulls farther ahead, and sooner. The big jump would be on March 15th, which is a day of several primaries, including Florida, Illinois, and North Carolina. In this model, a close campaign shifts to a strong Sanders lead, and Bernie does not look back.
Those two scenarios represent two very different primary seasons, indeed!
I will update or redo these models after the next primary or two. Between Nevada and South Carolina, we can get much better data on the ethnic effects on the numbers, though of course, it will still be very provisional. Those data will be limited by not being extensive, but will represent a lot of diversity. On Super Tuesday (March 1st) enough data from a bunch of primaries across the US will allow, I think, a very accurate model that will probably predict the outcome of the primary season IF whatever the status quo on that day happens to be maintains into the future. After that, differences from whatever looks apparent will require something to happen or change to cause voters to do the unexpected.
I find it funny that the white US establishment hopes that the African Americans will save their late Roman decadence, but the evidence for that does not seem that strong. Yes, there is a difference in the national polling, but isn't that mainly name recognition? Clinton was also ahead of Obama in 2008 among African Americans until they had to actually vote and make up their minds. There is not much difference in the proposed policies.
So I am not sure whether you model predictors are that predictive.
May i ask as an outsider, why are there hardly any polling results for Nevada and South Carolina? The last polls are for January and December.
Polling is expensive and tends to be done more on states that are bigger. Iowa and NH have lots of polling because they are early. But there will be some polls, I think, in SC. Often Nevada is ignored.
As to your first point, yes indeed, it is the way these things actually play out that matter. It should be possible to get a handle on some of this by the end of the day on Super Tuesday.
But even then, things can change. That's why we bother with the Primary process instead of just taking a poll in January and anointing a candidate!
The ultimate poll is ... wait for it ... the results of the primary election.
Wait for it...
Finally, there is a new poll in Nevada. It's a tie. 45% to 45%.
http://freebeacon.com/wp-content/uploads/2016/02/nv-toplines.pdf
This after polls from last years (most recent ones) with Clinton having an at least 20% lead.
http://projects.fivethirtyeight.com/election-2016/primary-forecast/neva…
No new results for South Carolina, yet.
"Will Clinton or Sanders win the Democratic Nomination?"
A logician can answer that easily: "Yes"
(cf. the mathematicians being asked "Does anyone want sugar in their tea?", which prompts the answer "I cannot say" from all apart from the last person, who says "No").
You spotted my little joke! (Revealed in the first sentence.)
Victor, interesting poll.
Victor beat me to it on the Nevada poll and, yes, it is interesting. Not sure that Nevada's results are really outside of expectations, but the poll does provide support for those that have speculated it could be ripe for a Sanders victory.
Victor, you do have to understand that Bill Clinton is often referred to as America's *first* black president. That's an indication of how well-loved he was by the African-American community. And in most southern states the African-American vote is more than 50% of the Democratic Party vote - so success in that demographic group is crucial.
If we go back 8 years, we can find this in the Washington Post:
"Obama has swamped Clinton among black voters in each of the 20 contests that had exit polls and large enough samples of African Americans to be meaningful. Just to put that kind of shutout in perspective, black voters represent the only demographic group that the New York senator has not carried at least once during the Democratic primary campaign. Obama now has such a lock on the loyalties of African Americans -- 84 percent of the black vote in Alabama, 87 percent in Georgia, 84 percent in Maryland, and on and on -- that the black vote is no longer contestable."
The problem for Clinton now is: Will they come back to her? They jilted her once -- granted for an actual African-American candidate -- but jilted her nonetheless. Add to that the fact younger voters don't remember her husband as President. *BUT* if she can solidly lock up the African-American vote (Greg's 70-30 ratio) she should win the nomination.
Returning to the subject of my comment on the previous politics post, which is electability:
I can't remember where I read the article (NYT?) but it discussed the different psychology of Black voters in particular, and perhaps it applies to "Hispanics" as well.
Having been disappointed and taken for granted and so on for...well, forever... they are disinclined to engage in wishful thinking; they do not have high expectations that a "revolution" is suddenly going to make their lives better. If anything, the election of President Obama served to bring out the very strong underlying racism in the US, not get us past it, reinforcing that skepticism.
So, I would say the proposed shift in minority response of the second model is a bit extreme. People without trust funds tend to be more conservative; the downside of a Republican victory matters a whole lot to the disadvantaged and potentially disenfranchised.
Also, I'm not sure why there would be much (potential) local variation. If we saw your projected numbers in a few early states, I think it would be a safe bet that Sanders would eventually be the victor.
If you look at the tab from the latest South Carolina poll, Clinton has a 74% to 19% advantage among African-American likely voters. Unless Sanders can reduce this advantage significantly in the coming weeks I'd agree with Greg's first model and put the nomination out of his reach.
I think the attack on Sanders' civil rights activism is designed to raise doubts about him particularly in the African-American community. Unfortunately this type of swiftboating isn't uncommon anymore in American politics.
Alternet, for instance, headlined their story on the piece "
How a Washington Post Writer's Attack on Bernie Sanders' Civil Rights Record Completely Backfired.' That's not likely. I think most people are aware that the original story does damage and the subsequent 'walk-back,' even eventual retraction, rarely undoes the original damage.
This might be of interest.
http://fivethirtyeight.com/features/bernie-sanderss-path-to-the-nominat…
And I would suspect that Sanders will do well in MN as well as WI. Massachusetts, as I've said before, is probably a good bet. But in the South he has to hope that he just loses by smaller -- much smaller- margins than predicted. And I suspect that PA is *not* going to be all that friendly to Sanders, nor states like New Jersey (which has a heavy influence of the "machine" and simply isn't good demographics for Sanders).
Endorsements by uncommitted and unelected delegates don't lead to "conspiracist ideation" ("ideation" seems to mean "thought that the speaker dislikes") by interested parties. They lead to interested parties' observing the very real, very public possibility that the person who gets a solid majority of the votes in the primary election campaign will be declared the loser. Clinton tried to win by that route in 2008 and it did not work for her, so probably it won't work now, but the route should not be available. "Minority wins" is the Republican way of doing things.
Jane, this has never happened. The interested parties generally know little about how the system works. Uncommitted delegates are responsible for their vote.
Jesse, thanks for the link. Similar approach to the one I took.
MN is not clear at all. At the moment Clinton seems way ahead among Democrats, but there seems to be strong and growing support for Sanders.