Filed under "data can be cool"
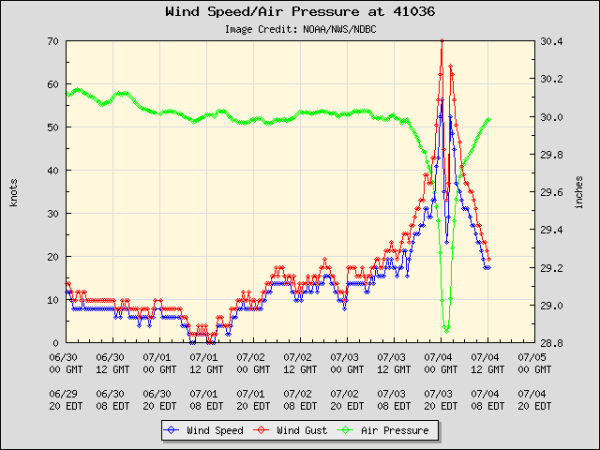
This is a graph of wind and air pressure at a weather station as a hurricane passes directly over. Notice the double spikes as each eye wall passes overhead.
- Log in to post comments
Filed under "data can be cool"
This is a graph of wind and air pressure at a weather station as a hurricane passes directly over. Notice the double spikes as each eye wall passes overhead.