
Over at Hullabaloo, Tristero is confused by Michael Gordon's claim that the surge has lowered the violence in Iraq:
What I'd like to know, instead, is whether the conclusions he draws in the paragraph quoted are reasonable ones based upon the evidence he presents. Likewise, I'm aware of the "correlation does not necessarily equal causation" fallacy which Gordon flirts with. In this case, tho, I think it is very reasonable to assume that additional military power might "cause" decreased numbers of attacks. I just don't see them; the improvements, except as noted above, seem to be mostly temporary fluctuations.
So I looked at the figures from the Michael Gordon article. The very short version is that I'm doubtful that there has been a trend in any direction, based on the data presented. Now for the longer version.
Before I get started, three disclaimers. First, I am not going to discuss Bayesian or likelihood approaches. Second, I'm writing this post for people who know very little or no statistics (hopefully...); if you know a lot of statistics, you clearly don't need the explanation, so don't be upset by any simplification. Third, there are other techniques one could use (e.g., sliding windows approaches), but I'm not going to discuss (in part, because I don't think they're the best way to analyze the data).
Ok, so how can we assess Gordon's claim? First, let's look at one of the figures:
Each of the horizontal vertical bars represents a month's worth of dead people. We want to know two things:
- Is the overall trend in mortality from the start of the surge to the end downward (i.e., fewer dead people per month)? You can't claim that the surge is working if deaths (or any other metric) isn't changing or actually increasing*. Note that it's the trend we're measuring--we don't want one abnormal month to throw things off.
- How does the trend during the surge (Feb. 14 to Aug. 14) compare to trends from other Feb. 14 to Aug. 14 periods? That last bit is very important--if, every year there is a comparable decrease in violence during that period (e.g., hotter days, longer daylight hours), then the surge has nothing to do with a downward trend.
So how do we determine if there is a 'downward trend'? Quite simply, we draw a line through the graph (I've made this figure up):
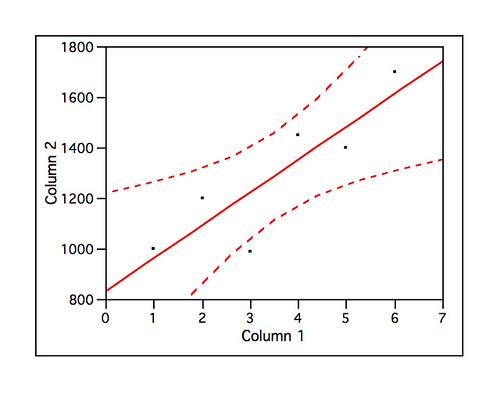
The vertical axis is the number of dead people. The horizontal axis is month. The dotted lines are the confidence intervals.
If the slope of the line is positive (elevates from left to right, as shown here), the number of deaths is increasing. If the slope of the line is negative (decline from left to right), the number of deaths is decreasing. If the line is essentially flat (has a slope of zero), then there is no significant change in the per month death rate. Mathematically, we attempt to draw a line such that it is as close to as many of the points as possible (this is known as linear regression).
A major problem with the Gordon data is that there are only six points, representing six months, to construct the line with. As you can see in the above graph, there are a lot of lines that can be drawn around six points (basically, any line that fits within the dotted lines). In other words, the precision of our estimate of the slope is very poor. If weekly data were presented, we could estimate the slope of the line far more accurately because there would twenty four points. A precise estimate of the slope matters because distinguishing between two 'fuzzy', imprecise slopes is difficult, even if the underlying reality is that they are different. It's like trying to read a book if you have poor vision without glasses--there really is something written there, but you can't make it out.
The other problem with presenting monthly data has to do with accuracy: is there really a pattern? You might look at a particular month, and think, "Damn, that was an awful month." In reality, that month was average, but there was a really bad week during that month. A couple of extreme weeks could fool you into thinking there was a trend, when, in fact, the mortality rate is relatively constant. Consider the following hypothetical data:
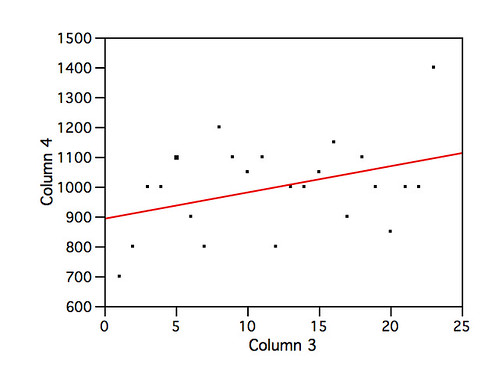
The axes are the same for the previous figure. These are completely fictional data.
Is there a trend? Maybe? Kinda. Sorta (actually not). But if you aggregated this weekly data into monthly data, you might think you spot a trend, when there really isn't one**. The point is that the weekly data also increase the accuracy of the estimate, not just the precision.
So, onto Gordon's pretty pictures. Let's look first at car bomb attacks (and remember, we're only looking at the February to August portions, even though the NY Times reports the whole year):
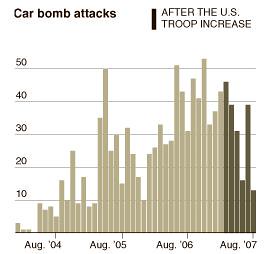
Now do you get why weekly data matter? Looking at the graph, I can't tell if the trend post-surge is decreasing or not--there are simply too few points to draw any conclusions. I think we can say, however, that car bombs did appear to increase between Feb.-August 2006, although it doesn't appear that the average number of car bombs in 2006 versus 2007 is significantly different.
Let's move onto I.E.D. attacks:
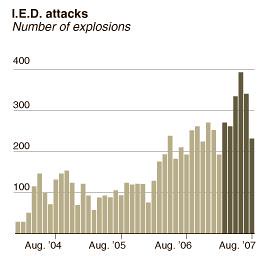
I think both 2006 and 2007 are roughly the same, and there doesn't seem to be much of trend in either direction for both years--again, we're hamstrung by the paucity of data.
Mortar and rocket attacks:
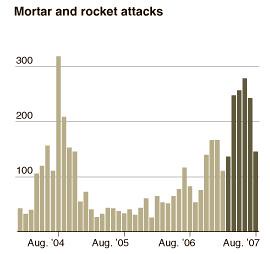
Again, there don't appear to be any up or down trends, but we can safely say that there were a lot more attacks in 2007 than 2006.
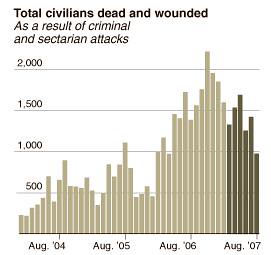
Total civilian dead people:
Here, I think you can make the argument that, in 2006, the trend in dead people was upward ('positive' seems an inappropriate adjective), while in 2007, the trend was downward. Oddly enough, the average number of dead people seems to be similar between these two time periods.
So, to answer Tristero's question, based on these four metrics, it's really hard to say that the surge is working: even where the trend is in the right direction (e.g., total civilains killed), it basically looks like the surge has only brought things back to where they were before they became really awful. For the other metrics, the only conclusion is that either it has had no effect (car bombs and IEDs) or has made things worse (mortar and rocket attacks). Of course, the data, as reported by the NY Times are relatively weak, so the odds of finding pro- or anti-surge patterns are not good.
Not exactly surgetastic evidence, but somehow I don't this will dissuade the proponents of the Grand Unified Theorem of the Surge.
*Making the claim that the surge slowed the rate of increase in deaths isn't a compelling policy argument (as opposed to a statistical argument), and isn't being made by any of the proponents of the surge that I'm aware of.
**Another statistical test that could be performed would be to determine if high mortality weeks are more likely to occur during the early time points (and, likewise, if low mortality weeks are more likely to occur during the later time points) than random chance. This would be a non-parametric permutation-based approach.
mutsuzum ben :D
bayanlarla sohbet odalari
chat odalari
chat sohbet
chat
bedava porno
sohbet
sohbet odalari
sohbet chat
bayanlarla sohbet odalari
chat odalari
chat sohbet
chat
bedava porno
sohbet
sohbet odalari
sohbet chat
Güncel Blog
sohbet
a. reo chunq web-sites ?
I certainly does appear that civilian deaths have decreased over the period of the surge. My opinion on why is that:
1. Something like 2M Iraqis are now refugees in other countries. Presumably these people fled from the worst areas. In addition the various sectarian groups have now separated. Sunnis have moved out of Shia areas and vice-versa.
2. They're running out of Iraqis to kill.
As evidence for *my* theory I'll point out that there was a downward trend for three months before the surge started.
What has been ignored (by almost everyone) is one major statistic: the number of displaced people.
As far as I can find out, this has not diminshed, it may actually have increased. It has now reached the order of 2 million people, mainly Sunnis, in many respects a bigger crisis than Darfur. In fact, Syria and Jordan have now closed their borders so things may well get worse.
The surest indicator that the surge is working will occur when people start to return to their homes in large numbers. This happened in Afghanistan after the invasion in 2002, an indicator that people were confident in the new government to keep decent order (that confidence may have declined since).
I have to add that I am very suspicious of the vaunted Sunni sheikhs of Anbar who have turned against al-Qaeda. That they have is well and good, however it is clear that
- they have been paid to do so by the US, so their loyalty may be as finite as the payments.
http://www.timesonline.co.uk/tol/news/world/iraq/article2414588.ece
- Some are probably in the pay also of Syria, and the unfolding events may benefit the Syrians in the long run. Syria has also cracked down on al-Qaeda.
- Few (if any) of the sheikhs have any sense of loyalty to the central Maliki government in Baghdad.
The cynic in me finds it suspiciously like the right-wing media drumming in favour of the Afghan mujahedeen when they were fighting the Russians. And we all know what happened after the Russians were beaten.
When a Head of State visits another country it is customary for him/ her to be photographed together with the local Head of State. I saw no shots of the Bush and Maliki together (though I may be subject to correction there), and certainly no shots of Maliki with the Anbar leaders. It is a sign that Maliki is probably on the way out, and that W has had enough of him.
I have to add that I am very suspicious of the vaunted Sunni sheikhs of Anbar who have turned against al-Qaeda. That they have is well and good, however it is clear that
- they have been paid to do so by the US, so their loyalty may be as finite as the payments.
http://www.timesonline.co.uk/tol/news/world/iraq/article2414588.ece
- Some are probably in the pay also of Syria, and the unfolding events may benefit the Syrians in the long run. Syria has also cracked down on al-Qaeda.
- Few (if any) of the sheikhs have any sense of loyalty to the central Maliki government in Baghdad.
The cynic in me finds it suspiciously like the right-wing media drumming in favour of the Afghan mujahedeen "freedom fighters" when they were battling the Russians. And we all know what happened after the Russians were beaten.
When a Head of State visits another country it is customary for him/ her to be photographed together with the local Head of State. I saw no shots of the Bush and Maliki together (though I may be subject to correction there), and certainly no shots of Maliki with the Anbar leaders. It is a sign that Maliki is probably on the way out, and that W has had enough of him.
Whatever happened to Ronald Reagan's Freedom Fighters?
Oh, yeah, right, sorry ...
The tragic reality is that noise is the friend of the cherry-picker. Given that so much of our political class, and the public is sufficiently math-averse to be fooled, we can easy endup drawing inappropriate conclusions.
I think your post was a very good attempt to appeal to the pattern recognition capabilities that even the most math-a-phobic find fun to use. Will we see likewise efforts in the appropriate forums?
I find it interesting that while car bombs and IED attacks have remained steady or decreased, mortar and rocket attacks have increased. This is sort of a predictable change in tactics responding to the influx of surge troops.
The surge could very well have "worked" in the sense of constraining the ability of insurgents to get close enough to vital targets to plant IEDs or detonate car bombs. But, in response, they've just switched to distance attacks (mortars) that allow them to score some quick kills and then dash off before the military response comes down on them.
Bit of a zero-sum, that.
NoAstronomer,
I think you're right--something was happening before the surge.
bigTom,
Thanks, and that's why I wrote the post--too many people are numerically illiterate, and can easily be fooled.
Mike,
Thanks, much. Clear as a bell.
The careful and painstaking work done by last year's Hopkins casualty paper nonetheless came up with uncertainties on the order of 25% for the number of fatalities. So in addition to everything else, these numbers surely need at least +-25% tacked onto them (in the unlikely event you think their collection and analysis was of a similar high quality). At which point the uncertainties on the fit slopes just turn into a bunch of noise.
More than that, the true number of deaths (or car bombs, or whatever else) is the number counted, divided by the "detection efficiency"--effectively,the probability that the deaths (or carbombs, or whatever) were reported to the relevant place (in this case, ultimately to the American military, as I understand it).
That detection efficiency correction nowhere appears in these numbers. If reporting probability was going up during this time, or going down, the true numbers would be completely different and the conclusions different.
To expand upon the excellent conclusions of your post, I'd note that trying to draw conclusions from efficiency-uncorrected data wouldn't get you through your first data-analysis seminar in graduate school without wishing you'd never been born.
To follow on the previous post...
As I understand it, there is quite a bit of disagreement with how the American military is counting Iraqi civilian deaths, so even the few data points that they present (by month) are in question.
I'm sure everyone has heard/read about how they classify deaths as being sectarian in nature if someone was shot in the back of the head, but as criminal or something else if they were shot from the front. I know I'm not the only one who finds this presumption utterly ridiculous.
Thanks
I think you're right--something was happening before the surge.
bigTom,
Thanks, and that's why I wrote the post--too many people are numerically illiterate, and can easily be fooled.
Will we see likewise efforts in the appropriate forums?I agree with bigTom.
They're running out of Iraqis to kill.
The tragic reality is that noise is the friend of the cherry-picker. Given that so much of our political class, and the public is sufficiently math-averse to be fooled, we can easy endup drawing inappropriate conclusions.
The true number of deaths is the number counted, divided by the "detection efficiency"--effectively,the probability that the deaths were reported to the relevant place .That detection efficiency correction nowhere appears in these numbers. If reporting probability was going up during this time, or going down, the true numbers would be completely different and the conclusions different.
You can find some good news here always.I look forward the other.
very nice
thanks
ooh good blog thanks forever my happy new year
Filmizle,Film izle,Dizi izle,Bedava film izle
thanks for this great information.
thanks so much
mutluyum ulan
Bebek Oyunları
Araba Oyunları
Barbie Oyunları
Yeni oyunlar
Çocuk Oyunları
Play Free Online Games
Free Online Games
Spielen
Sohbet
Full film izle
film izle
film seyret
Film izlesene
Film izlesene
perdeler hakkında tüm açıklamalar
faydali bir blog calismasi
bedava sohbet
thanks
thanks
thank you
thanz.
good.
Thank you..
thanks for you
very good information