
My thanks to the readers who noted that I accidentally used adjusted income in my calculations of the ratio of the median house price to the median wage. Below are the updated figures:
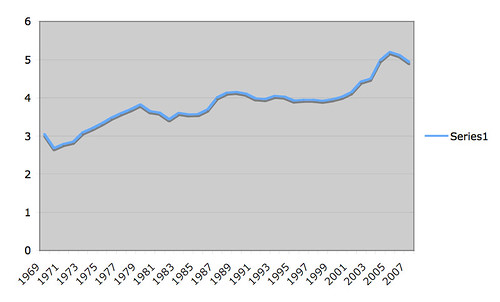
Below, on the Y-axis, is the ratio of the median house price (not adjusted for inflation; from here) to the median income (not adjusted for inflation; from here). So a value of 1.0 means that the median house costs as much as the median income, a value of 2.0 means that the median house costs twice as much as the median income:
Here are the underlying numbers; obviously, median housing price is the higher line, and median income is the lower line:
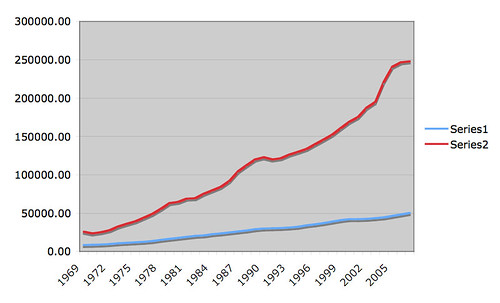
(for reference, the first point on the income line is $8,389)
From Bloomberg today:
California home prices dropped 41 percent last month from a year earlier, more than double the U.S. decline, as surging foreclosures drove down values, the state Association of Realtors said today.
The median price for an existing, single-family detached home in California sank to $247,590 in February from $418,260 a year earlier, the Los Angeles-based group said in a statement. The U.S. median price fell 16 percent during the same period, the second-biggest drop on record, according to the National Association of Realtors.
The median price in the U.S. is about right if you have a ratio of 4.0 (i.e., 1999). I certainly don't see it rising. If you want the 3.0 observed in 1969, prices need to drop about 20% more. Without funny money floating around, I'm guessing prices will drop. They certainly won't increase.
(and never blog when you're coming down with a cold)
- Log in to post comments
Where can one get similar figures for other countries? I'd be curious to see what the curves look like for western European countries over the same time period. I'd also like to see 1945-1966 data. I suspect that the number hovers around 3 until the early 70's.
I don't see the graph. Is the problem on my end? What could it be? I don't remember any changes.
Thanks for the correction, Mike. This is one of the most important parts of scientific training: the humility to admit a goof in the face of data. I contrast this with the continuing blather by George Will on global warming. If he just had the humility and integrity to admit a mistake, the whole episode would have blown over by now. But instead the argument now is all about defending his turf, not finding the truth.
Back to your data. I agree with your analysis, housing prices need to come down before this financial mess can be solved. I've bought houses in each of the last 4 decades and the basic financial advice has always been the same: a person can afford a mortgage that is about 2 to 2.5 times their income. As long as prices stay 3 to 5 times above income, people will continue to either fail to get loans, or default on the ones they get. The present plan of throwing money at the banks to support home prices will just prolong the misery and run up the national debt for no gain.
a person can afford a mortgage that is about 2 to 2.5 times their income
As I mentioned on the last thread, the traditional advice was to buy a house for not more than 3x income. I neglected to mention that most houses (including mine) were bought with 20% down payments, which would put the mortgage amount in the range you give. There are various reasons for putting 20% down, chief among them the substantially reduced risk of loss to the lender in case of default: somebody with that much skin in the game is only going to default if he really *can't* pay, and the lender would probably get most or all of the outstanding balance plus reasonable expenses in the subsequent foreclosure sale. (This is the reason why you have to buy mortgage insurance when buying a house with less than 20% down.)
Of course, the 20% down payment rule went out the window during the housing bubble. One obvious reason was that hardly anybody who wasn't selling an existing home could come up with that kind of money for a down payment. Since the lenders were happy to lend anyway, often 100% (and sometimes even more) of the value of the house, lots of buyers--even those who didn't use negative amortization and other "affordability" products--found themselves underwater when the bubble burst.
Jim - you have been getting advice from different people than I have. As I think I mentioned in the other thread, the advice I've always heard is that your housing costs should be no more than 1/3 of your income. Looking at the little tool on www.realtor.com, they think the current rate is 5.08%. A 250K house with a 20% down payment (50K) has a $1083 monthly payment. I always figure one should add taxes and homeowners insurance to this (Although from what I've seen, banks do not always add these, which is how some people get into trouble). Taxes and insurance can vary a lot, but lets go with adding 50% to the payment to cover those (that's more than I pay). That brings the monthly payment to about $1625. That's $19500 a year, so someone making $60K a year should be ok buying a $250K house at THIS interest rate. That's a ratio of 4.17. If, however, interest rates go up to 8.08%, then the basic payment goes up to $1479, and if we assume taxes and insurance stay the same, that's 2021/mo or $24252 a year, so you would need to be making about $73K a year for a ratio of 3.42. At a 12.08% interest rate, it is $2070/mo for the basic, for $2612 total, which is $31344/year, requiring a salary of $94,032, and a ratio of 2.66.
The point is that it is the size of the payments, not the ratio of house price to income, that determine affordability.
The point is that it is the size of the payments, not the ratio of house price to income, that determine affordability.
That is a technically true but completely misleading statement. Following this advice would have led your average buyer to take out one of the toxic mortgages that were prevalent during the bubble. After all, if your monthly payment isn't covering the interest on your option ARM loan, that loan looks a whole lot more affordable than a traditional mortgage.
Some other comments on your calculations:
1. I have heard via various sources that the standard, back when standards existed, was a maximum payment of 28% of your income for the mortgage, and 36% for all of your debts including the mortgage. Of course this should include taxes and insurance, which for me are significantly higher than your estimates: 87% of my P&I payment, on a much higher rate than in your example. In some cases you could get approval for 33% DTI for the mortgage only, but usually at a higher interest rate, to compensate the lender for the additional risk.
2. Even on a fixed rate mortgage, taxes and insurance rates go up. Taxes will go up much more in the next few years to cover holes in state and local budgets--this has long been the case in my town, as there is no other significant revenue source to pay for health insurance costs for town and school district employees. (If you are in a jurisdiction such as CA where property tax increases are capped, the tax increases will take other forms.) As for insurance, ask anybody in Florida. Some people who were fine originally and would have been fine with increases around the inflation rate in taxes and insurance are in trouble because this part of the bill grew much faster than inflation.
3. Fixed rate mortgages are not available in all markets. I understand that if you buy in the UK an ARM is your only option.
4. The first interest rate you quote is unusually low by historical standards, and it is available only to people who qualify as prime customers. Most potential borrowers, if they can get loans at all, will pay a noticeably higher rate. I expect interest rates will be higher, perhaps much higher, within a year or two. The standard of 3x income for a maximum house price is a close enough approximation for interest rates typical of most of the 1970s through 1990s.
Eric - I was assuming a fixed rate traditional loan. I would never go near an ARM myself. I've bought 3 houses myself and always put more than 20% down, which I realize not everyone is able to do. On none of my houses have taxes & insurance been anywhere near 87% at the start of the loan - they have all been less than 50% at the start. I am aware that these costs do tend to go up with time, but we are talking about qualifying for a loan, so it's the 1st year's taxes and insurance that we should be looking at, not a number of years in. While taxes and insurance tend to go up, so does income for working families. I am well aware of all the vagaries of insurance rates, having experienced them 1st hand.
Also, on the 28% - the bankers I've talked to do not seem to include insurance and taxes in that 28%. I agree with you that they should look at it, but it seems like they put taxes and insurance in a different pot than "debt."
Finally, yes the rate I quoted is low, yes it is a preferred rate, but it is a real rate from TODAY. I saw a headline that rates are at a low right now. But that's part of point and why I threw in the other two examples at higher rates. I seem to recall that rates have been as high as 12% as well. When you sign mortgage papers, there is a form they give you showing how much the house will cost you including all the interest, and even when the rate is down to 5%, the interest is more than the cost of the house for a 30-year fixed loan. So, to elaborate on my original point:
Given a 30 year fixed loan, the size of the monthly payment is what determines what you can afford. The size of the monthly payment is determined by both the interest rate and the loan amount. Taxes and insurance should be taken into account in monthly payments, but frequently are not. The ratio of house price to income only looks at the loan amount and is insufficient on its own to determine affordability, although the 3x rule has been a good approximation for interest rates over the past few decades.
Note that if interest rates went up to 25% then even a 2x rule would have many people buying houses they couldn't afford.
I'm actually not sure what we are saying is really that different - and I'm fully aware that the system is vastly more complicated and there are many factors that neither of us have touched on yet.
Edward:
I gave the numbers that were related to the original topic which was housing prices versus annual income. Those are the rough guidelines I was told on several occasions. As you point out, for the individual the real issue is what percent of monthly income is absorbed in the mortgage.
I think your example of 1/3 of monthly salary is at the very top end of borrowing limits, and is a risky loan. And it assumes the borrower has no other long term commitments such as car loans or credit card debt. If taxes or insurance go up, or monthly income goes down, or there is an emergency expense, the borrower can be in serious trouble. Which I think is exactly how we got into the present default mess: adustable rate mortgages going up while a recession is causing income to go down.
So you are technically correct. But I personally favor the more conservative position.
I was just looking at a real estate pricing site (www.zillow.com) and I noticed something that made me think the above stats may contain a flaw:
The home prices above are based on (I think) the median price of homes sold. Now, since it costs something to move, it might be reasonable to expect that richer people buying more expensive homes will move more often than less wealthy people buying less expensive homes. This means that the median price of houses sold will be skewed higher than the value of the homes bought. Two ways to correct for this would be to either limit the data to 1st time home buyers or to adjust the data for time since the pervious sale.
The reason that I think this might be an issue is that, as of this moment, according to Zillow, the median VALUE of homes in the US is $200,868. It's possible that home prices have fallen that much so that could be median sales price now. However, looking at Zillow's historical data for the past 10 years, it looks like their estimates for median home value in the US are generally lower than the published data on median sales price, sometimes by as much as $30-40K, sometimes by only a few thousand.