
Yesterday, I described the relationship between low-income and poor performance in English and math in Massachusetts (see the post for methodological details). Well, I've saved the worst for last--science education:
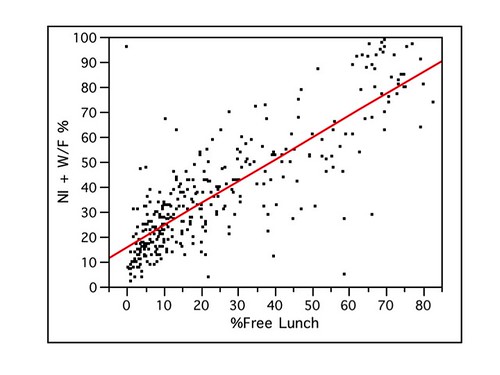
Just to remind everyone, the horizontal axis is the percentage of children in a school who qualify for free lunch, and the vertical axis is the percentage of children who, according to their MCAS scores, are either classified as "Need Improvement" or "Warning/Failing" in science.
The R2--how much of the school to school variation is accounted for by variation in school lunch eligibility--is 0.69, which is a stronger relationship than seen with either the English or math scores. Worse, the slope of the line is 0.88, which means that a one percent increase in school lunch eligibility means the expected percentage of poorly performing students in math increases 0.88%, which is also much higher than either English or math.
A note about the difficulty of the science portion of the MCAS. It is more difficult in that the y-intercept of the science education regression is significantly higher (this is how high the line is 'pushed up' the graph; if you remember your algebra, this is the "b" in "y = mx + b"). However, this should not be reflected in the steeper increase in poor performance due to low-income. It's also interesting that the variance around the estimate, unlike either the English or math scores doesn't increase with increasing poverty. I'm not sure what to make of that though.
Just to remind you, statewide, the top quartile (the 75% highest) is 38.1%, while the lowest (25% 'highest') is 7.8%. Thus, the expected tenth grade science poor performance rates are 49.5% and 22.9%, respectively. If we compare the poorest tenth percentile (66.1%) to the wealthiest tenth (3.8%), the expected difference in poor performance rates is even starker: 19.4% versus 74.1%. As I noted yesterday, some schools will perform better, but some also do worse than expected.
Poverty is something that's never mentioned in improving K-12 science education, yet it's critical to performance. It seems to me we're dancing around a key issue. If we want to improve K-12 scientific literacy, the biggest variable is income inequality. The more I look at these data--and the MCAS database has a lot of other data--poverty keeps rearing its head. I realize that correlation does not equal causality (yes, I too can read cookie fortunes), but the signal is so strong and stark that it is overwhelming other demographic factors (English as a second language, for instance, is a rather weak predictor of performance).
Keep in mind these data are from Massachusetts, which not only has high educational performance, but performs better than 'demographic destiny' would predict. Yet low-income schools are still getting whacked, especially in science. I suspect that this is partly due to No Child Left Behind along with other educational 'reforms' which have emphasized English and math at the expense of science, but that's just speculation on my part.
But blaming teachers is so much easier. And it allows us to worship the 'metrics.' So we'll probably be pursuing marginal educational 'reforms' instead of tackling a huge impediment to science education: poverty.
But how would you propose lowering poverty? Seems to me like the only two options that might possibly work are either putting up very large trade tariffs that could increase the value of less skilled labor, or taxing the rich and providing public services - like for example education. Improving education (and access to it) is a way to alleviate poverty, so I don't know what your point is.
Coriolis - One way would be imposing federal laws requiring all state educational funding to be equally distributed per student to all schools. As it stands, in many states (including the two I was educated in, LA & FL), schools are only funded by local property taxes for the school district, so poor neighborhoods get shitty schools and rich neighborhoods get great schools.
Coriolis, you are confusing ends with means. True, there are feedbacks, but Mike seems to be implying that decreasing poverty will be a means toward improving testing. True, increased education quality (measured through testing) will lead to/maintain improved incomes, but the graphs appear to show (at least to me) that unless you can access good education, you cannot improve your economic condition. Therefore, in order to get onto the track of improving one's economic condition, you need to be "kick-started" into that cycle, and the graphs (and a whole bunch of literature on the topic) seem to point to the additional benefits to education (and thus the future of the country) by alleviating poverty (as the means to start achieving this as opposed to the expected outcome).
As an analogy, assume that investing in the stock market will earn you extra money, which you could then re-invest in the stock market, giving you extra money, etc., etc.; the stock market generates wealth. This would be great if you had enough money available to invest some of it in the stock market. If you are living hand-to-mouth or paycheck-to-paycheck, you have no ability to tap into the capital-generation-capacity of the stock market. In other words, the ends (stock-market-generated wealth) cannot be achieved unless you have enough means (disposable-income wealth).
In other words, while you are not incorrect in your assumption, your model does not take into account the extreme cases, which are the ones about which Mike is talking.
Can you securely disentangle cause from effect here? I'm not at all convinced that you can. I suspect a strongly entangled connection...which might well mean that eliminating poverty wouldn't end the problem.
OTOH, I do consider that a large difference between the most wealthy and the most impoverished is dangerous to democratic society. If you want to propose a treatment I'd suggest something along the lines of forbidding the top executives of a company from receiving more than a certain amount of income (from all sources), and that amount to be based on the salaries of the lowest paid workers in the company and on the number of workers. (Say allow an average of 5 workers per supervisor, 5 supervisors per manager, etc. and a 10% average increment in pay between levels when designing the function...but don't mandate this structure.)
It might work, or at least work slightly better. Or possibly make the maximum around the mean salary at the firm times the square root of the number of workers. There's probably no "exactly right" answer, but it wouldn't be hard to do better than "I'm going to pay you a little as possible, and I'm going to hide from you how much I'm paying myself."
I suspect that social put downs has a lot to do with why poorer students do more poorly. They spend all their effort trying to figure out how to become more socially accepted, so English helps, but science is surplussage. (Plus, considering how poorly science is taught in schools, if you don't learn it outside of school, you aren't going to learn it.)
It's not so much that I'm confusing them as that there isn't a clear judgment to be made. Does lack of education lead to poverty, or does poverty lead to lack of education? This is a chicken and egg problem, and rather meaningless to argue either way. What is likely true is that the two are correlated and that if you lower poverty, by say providing more decent jobs to poor people, you'd indirectly improve their (or their children's) education, and also if you make better education more easily accessible then that should in turn alleviate poverty. That's why I see Mike's argument as a bit beside the point.
And at some point we have to keep in mind the politics of all this as it relates to the USA. At this point trying to push for trade tariffs or taxes on rich people is still pretty hard - on the other hand it seems like it may be easier to push for more education money. Or so it seems.
I think Mike's underlying complaint is actually with regards to all the new zeal for standardized testing, and deciding who's a good teacher and who isn't. But the problem with that has nothing to do with poverty - the problem is that it's hard to tell who's really a good teacher.
Mokele,
You're wrong on the facts, at least in regards to Florida (where I teach). While Florida funding for K-12 education is generally poor, there is state funding and a formula based on local property values as to how much that share should be. So, wealthier districts do end up paying a higher share of their own costs than poor ones. Overall, about 40% of funding comes from state sources, 51% from local taxes, and 9% from federal sources.(See this document for the official report on state education funding.) I'm sure that these formulas don't even things out completely, but it is not nearly as dramatic in Florida as it can be elsewhere in the country.
Coriolis: "But how would you propose lowering poverty?"
Milton Friedman had a radical suggestion for helping the poor: Give them money.
Doing so has good effects for others, too, as the poor spend their money, effecting a transfer to the rest of the economy. :)
Levitt and Dubner wrote in FREAKONOMICS about the correlation of early childhood academic performance and various family characteristics based on a US Department of Education study. Family income and parents' level of education both have a strong positive correlation with successful academic performance. Parents with high levels of educational attainment, also tended to make more money, and tended to have children who performed better academically.
JasonTD - thanks for in info, and while I may be wrong about minor details, it's still correct to say that schools in wealthy neighborhoods get more funding and more resources than schools in poor neighborhoods, a profoundly inequitable and unjust situation.
Perhaps I'm being thick, but I do not see school lunch info on the MCAS site (the NI + W/F are clearly labeled). I'd like to regraph this ... could you advise where to find the lunch data?
"So we'll probably be pursuing marginal educational 'reforms' instead of tackling a huge impediment to science education: poverty."
I agree completely that schools in poorer areas should receive the same level of funding that schools in wealthier districts do. The disparities are obscene. I want to be clear on this point.
One of the things that's so frustrating about attitudes toward education in this country is the refusal to accept that some kids --- many kids --- are below average cognitively. They simply don't learn as fast as their peers, and you can't change that fact, any more than you can turn all the below-average athletes into above-average varsity performers. It won't happen.
Yet many people ignore this fact and choose a romantic idea that all children can perform age-grade level. This approach seems --- to me at least --- to be cruel. People know when they aren't good at stuff, and lying to them by saying that they can do , really truly! just creates feelings of inadequacy. Why can't we present material more slowly to some kids? What's so bad about ability grouping and letting kids repeat a year?
There are below-average learners in all economic groups, but educated people tend to earn more and therefore tend fill out the higher economic groups.
Their kids tend to be brighter, and therefore have a better shot at doing well in school. Sure, they have other advantages, but being smarter is the biggest one. Intelligent people tend to be interested in learning --- just like talented athletes tend to be interested in athletics and people who are good at art like to get involved in art. It's natural. Yet we try to pretend that being less smart isn't a big factor in educational outcomes.
If our society was really serious about helping poor kids do better in school, we'd be making sure that poor pregnant women get high-quality healthcare and that everyone could afford high-quality fresh food. Those free lunches at school would be a great place to start: ban the french fries and bring on the crunchy bell peppers. These two solutions could have a positive effect, yet we ignore them and look for, you know, marginal "reforms."
Sigh. Rant off. Thanks for reading.
@Mokele: "Coriolis - One way would be imposing federal laws requiring all state educational funding to be equally distributed per student to all schools."
That does little to address poverty. It does bring money into poor communities through the wages associated with that education funding, which should create a little more opportunity, but beyond that, it wouldn't.
The only thing that would matter is a change in income distribution generally. Right now we've got the most unequal income distribution in the developed world (and we have for decades, but it's just gone from "higher" to "no contest.") People get all indignant if you say that, as though you're taking from the rich (who are deserving because of free-market idealism that has no basis in reality and requires ignorance of the actual state of markets, and which is associated with this Randian image of the rugged individualist who has earned that wealth through his own labor and ingenuity; and because of the Prosperity Gospel, which is the Cliffs Notes version of the aforementioned horseshit) to give to the poor/undeserving/lazy/browns.
@Mark D McCarthy:
That just shows that the poor are genetically inferior.
@Val
"Yet many people ignore this fact and choose a romantic idea that all children can perform age-grade level. This approach seems --- to me at least --- to be cruel. People know when they aren't good at stuff, and lying to them by saying that they can do , really truly! just creates feelings of inadequacy. Why can't we present material more slowly to some kids? What's so bad about ability grouping and letting kids repeat a year?"
http://www.youtube.com/watch?v=u5um8QWWRvo
@Ian, genetically inferior? I have to assume you are kidding.
I done good work on Over Taxes Wouldnât End Some inadequacy visit it.
http://authorshive.com/2011/01/21/over-taxes-wouâ¦ome-inadequacy/
grade level. This approach seems --- to me at least --- to be cruel. People know when they aren't good at stuff, and lying to them by saying that they can do , really truly! just creates