
By way of Observational Epidemiology, we find an interesting NY Times article by Michael Winerip describing a seventh grade teacher's experience with value added testing in New York City. I'll get to value added testing in a bit, but the story also highlights why we need more reporters who have backgrounds in math and science. Winerip:
On the surface the report seems straightforward. Ms. Isaacson's students had a prior proficiency score of 3.57. Her students were predicted to get a 3.69 -- based on the scores of comparable students around the city. Her students actually scored 3.63. So Ms. Isaacson's value added is 3.63-3.69.
What you would think this means is that Ms. Isaacson's students averaged 3.57 on the test the year before; they were predicted to average 3.69 this year; they actually averaged 3.63, giving her a value added of 0.06 below zero.
Wrong.
These are not averages. For example, the department defines Ms. Isaacson's 3.57 prior proficiency as "the average prior year proficiency rating of the students who contribute to a teacher's value added score."
Right.
The calculation for Ms. Isaacson's 3.69 predicted score is even more daunting. It is based on 32 variables -- including whether a student was "retained in grade before pretest year" and whether a student is "new to city in pretest or post-test year."
Those 32 variables are plugged into a statistical model that looks like one of those equations that in "Good Will Hunting" only Matt Damon was capable of solving.
The process appears transparent, but it is clear as mud, even for smart lay people like teachers, principals and -- I hesitate to say this -- journalists.
What's freaking Winerip out? This:
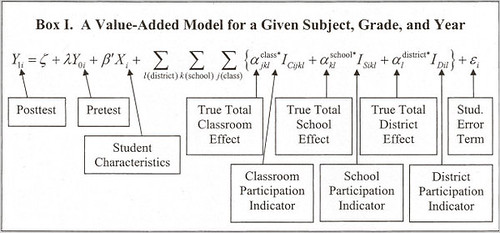
AAAIIIEEEEE!!!!
If the journalist in question is unable to understand linear regression, then maybe said journalist shouldn't be reporting the story. Given the importance of understanding the method--and its flaws--a statistically literate reporter is essential for this story, although Nate Silver can't do everything, I suppose.
If you have the training, it's not hard to understand at all (and if our elite finishing schools actually educated most of their students, they should be able to understand this). Sadly, many of our elite journalists are out of their depth when the math moves beyond arithmetic. A good newspaper would hire an art critic with knowledge of the subject, so why not here too? Mathematics is a skill, not magic.
It's too bad, since understanding what happened to the teacher Winerip covers, Stacey Issacson, is really critical. In NYC, student achievement, based on an exam, is classifed into four levels, 1-4 (and, no, membership in each category doesn't scale linearly[LA times]). The average score for each teacher is then calculated. Using the scary formula above, the school administration can then gauge (supposedly) how effective the teacher is. Issacson, who teaches at an elite school, has 65 out of 66 students meet standards (a score of 3 or 4), with an average of 3.63. If she performed at the average level (50th percentile) her students should have had a score of 3.69.
Andrew Gelman breaks down the numbers using that complex tool known as algebra and identifies the difference between between a score where Issacson would have received tenure versus a failing teacher (7th percentile): failure is 43 "4s" and 22 "3s" while average, tenure granting peformance is 47 "4s" and 18 "3s". Basically, the difference is four kids doing a little better on an exam (in the worst case, one could have four students right at the edge). Does anyone believe that this is a real difference? Anyone who has ever taught at any educational level? Winerip correctly notes that there's a lack of precision around this estimate:
Moreover, as the city indicates on the data reports, there is a large margin of error. So Ms. Isaacson's 7th percentile could actually be as low as zero or as high as the 52nd percentile -- a score that could have earned her tenure.
So, basically, we have 'progressives' lauding a teacher evaluation method ("measurable differences") that can't really measure if a teacher is doing a good job. The method works great, except that it can't tell if you're succeeding or failing.
Yet teachers--and not the politicians, adminstrators, and ignorant pundits who support these foolish policies--are the problem.
In light of these inaccurate guestimates, teachers have every right to be angry about education 'reform.'
A statistical aside: The method above assumes linearity-- a * I. That's fine if you're trying to establish a general pattern, but if you're trying to accurately predict what should happen and minimize the residual, you probably need a more complex 'link function.'
- Log in to post comments
Sixty-five samples of at most two bits and they're trying to derive three-digit conclusions?
Boggle.
Even more amazing: They are applying a regression formula with 32 variables. A formula with that many variables has a predictive capability of just about nil (or, to put it in layman's terms, bovine excrement). Even if each of the variables were a binary yes/no, you would need more than 4 billion students to have one student for each bin, and that's far from a guarantee that you would have a student in every bin.
In this case, I don't blame the journalist for failing to understand why the school district is using that formula. You don't need any expertise in statistics to conclude that something is wrong here.
Thank you for posting this critique. I would also like to point out that, just as a matter of human motivation, task feedback that is this complex procedurally and yet produces highly oversimplified results do not inspire or encourage professional growth. In other words, besides being demeaning to educated, trained professionals, it's hard to look at the numbers (e.g. 3.69) and know in which area one should look to improve.
I'm one of those mathematically ignorant 'edumacated' folks that shudders when they see that equation. Even though I understand the general idea of linear regression, and I'm fine with looking at a scatterplot and an R^2 and doing a basic 'sensibleness' check, that doesn't mean I could practically produce one by hand.
Can you show us a better way, or is there not enough information?
What would happen if you added multiple years worth of data in? @D.C. Sessions- I get your criticism in a sort of intuitive feel way, but perhaps it would be clearer if I knew how many samples one would need. 650? 6500?
After reading your linked post, I see why a linear regression might not be a good choice. I would really like to see it done better, and be able to follow the math properly though.
The school district is using that random number formula because it gives them something easy to measure so they can shirk responsibility.
Basing decisions on what is essentially a random number generator will end up counterproductive: http://en.wikipedia.org/wiki/W._Edwards_Deming#Seven_Deadly_Diseases
Oh God, there the liberals go again with their elitist clinging to 'reality' and 'reason'. Poppy-cock!
People wanted teachers to be evaluated on an objective, performance-based system that makes differences measurable. And this is an undeniably objective, undeniably performance-based system that undeniably results in measurable differences. You put performance data in, evaluations come out - it's perfect! But no, suddenly the results are supposed to actually "mean something", or "reflect reality" or some such high-falutin' nonsense.
There's just no pleasing you, is there? If we start again with all of that reality-based this and that, and facts and whatnot, we might just as well never have stopped caring about education!
@becca: I'm not sure DCS is calculating the expected error the same way I would, but here is how I would do it.
As Mike implies in the original post, a student who scored a 3 on this exam might have been a nominal 2 who had a good day or a nominal 4 who had a bad day. This is discretization error, which will be present even if the test is otherwise perfectly designed. It is generally assumed, at least in physics applications, that the measurement error due to discretization will be +/-1 in the last quoted significant figure. If you have N students taking the test, and you can assume that errors are uncorrelated (not necessarily a good assumption, since poor test design, for instance, would give errors that are correlated), then the expected error in their average score will be 1/sqrt(N) times the expected error in an individual student's score. So if the school district wants to carry this computation out to three significant figures, they will need approximately 10000 students. Or, to turn this around, the expected error from averaging the scores of 66 students is about 0.12. Therefore her stated average score of 3.63 could be consistent with anything from 3.51 (making her worse than useless, according to the formula) to 3.75 (noticeably higher than her "expected" value).
Criticizing that particular formulation does not show that it can't be well done. Saying that there is uncertainty in the result does not show that even that method is useless.
I don't know about you, but when I get assay results they do contain noise - get used to it!!! I don't even need to say that to scientists, right? Even if they contain tremendous noise, they can still be useful. Reducing the noise should be a goal, yes. Using more than one classes or years worth of data would also be helpful - I've heard more data is good.
I think you've gone to the "it's not perfect so it's useless" land.
Re: rork. No, we're in a position where it is essentially a random number generator (as mentioned above) throughout the range at which it will actually be used, and that we will be making decisions about hiring, firing, and payment of teachers based on this. Apparently we are to expect that subjecting teachers' futures to what amounts to the whims of chance, and paying a damned lot of money to do it, will ultimately increase student performance.
I know, I know. Variable schedule rewards can be pretty effective if implemented correctly. Pull the slot lever and all that. But they aren't necessarily motivation for people to pull that slot lever any better, are they. We're awfully quick to assume this will have no effect whatsoever on teacher morale, or that learned helplessness (given how punitive all this actually is) isn't a far more likely result.
Even if they contain tremendous noise, they can still be useful.
I know I'm succumbing to "Someone is wrong on the Internet" syndrome here, but:
The fact that you have noise in your results limits the information you can get from them. This becomes especially important when you are trying to measure differences. In this case, by the crude error estimate I gave @7, the teacher's actual performance relative to her expected performance is -0.06+/-0.12. I don't know about your planet, but here in the real world we would call that "not significantly different from zero." You can call a teacher who gets a 3.63 on an expected performance of 3.09 a great teacher, or one who gets a 3.13 when 3.69 was expected a terrible teacher--that's a sensible interpretation, since the differences are well outside the error bars. But in a case like this teacher's, you simply cannot tell. It would be like assaying two pieces of metal, getting results that say they are both Fe-Ni alloys of 51-49 and 49-51, respectively, with error bars in both cases of 5%, and claiming that they are different alloys. Maybe they are, but your assays don't prove it.
I only agree that the interpretation and decision making based on the score should be cautious, aware of the noise.
I don't yet agree that it's a random number generator.
Just how good the score is at discriminating the very bad from the good is not known (to me) since it appears we don't have a gold standard (set of scores from teachers labeled as very bad or good by a separate method we trust). We want a posterior distribution on the probability of "very bad" given the data, right? That will show what the model thinks about how certain "very bad" is. It will never be certain, but it might be informative. To make an extreme example if I had to choose which of the two pieces of metal have more Fe, I would pick the one assayed at 51% over the one assayed at 49% - regardless of the variance. I may be very uncertain about whether I am choosing correctly, but it's better than ignoring the data and flipping a coin. I'm just trying to make a distinction between "crappy data" and "useless data".
That equation might as well be Greek to me ;) but even I can tell that it is an attempt to give the appearance of measuring precisely something that cannot be measured precisely. "Politicians, administrators, and ignorant pundits" likely know that it is bs, but want to cover their own behinds and save their own bloated salaries.