
Last week, I did a post for Forbes on the surprisingly complicated physics of a light bulb. Incandescent light bulbs produce a spectrum that's basically blackbody radiation, but if you think about it, that's kind of amazing given that the atoms making up the filament have quantized states, and can absorb and emit only discrete frequencies of light. The transition from the line spectra characteristic of particular atoms to the broad and smooth spectrum of black-body radiation is kind of amazing.
The way you get from the one to the other is through repeated off-resonant scattering. The probability of any particular atom emitting a photon with a wavelength drastically different from its characteristic spectral lines is extremely low, but it can happen. And once it does, those new photons are unlikely to scatter again. So, in a sufficiently large sample of atoms, where an emitted photon is guaranteed to scatter many times on the way out, the light that finally escapes is pushed to longer wavelengths.
That post is based on this old blog post thinking out loud about this stuff, and more specifically on this AJP article that I was pointed to in the comments to that post. The article includes a simple model showing how you can take a bunch of two-level "hydrogen" atoms that absorb and emit in the deep ultraviolet (Lyman-alpha light, in spectroscopic terms) and end up with a black-body spectrum once the sample gets sufficiently optically thick.
It's a very nice paper, and I recommend reading it, but it does have one aspect that might feel like a cheat. The spectra they generate are based on solving the equations Einstein used in his famous 1917 paper on the statistical behavior of light quanta, assuming a particular temperature for the atoms. They do some work to get this in terms of the optical thickness of the sample, but they're always dealing with continuous functions, not discrete probabilistic absorption.
On some level, what you'd really like to see is a Monte Carlo simulation of this sort of thing, where you look at absorption and emission events by individual atoms, and see how that builds up light at lower frequencies. So I wrote one.
Well,sort of. My numerical simulation skills remain pretty rudimentary, but I cobbled together a crude thing in VPython. I put the code on Gist (GlowScript didn't like it), so you can point and laugh:
So, what is this doing? Well, I imagined a collection of "atoms" with a single transition frequency that it likes to absorb or emit, but two lower-frequency modes of possible light. Why three? Because that lets me store the state of the light as a vector object in VPython, saving me from having to figure out how to do arrays with more components. I imagined a single photon of light at the main transition frequency coming into a large array of these atoms, which could absorb it and then re-emit something.
A photon at the main transition frequency is represented by a vector (1,0,0), and is assumed to be absorbed (you could imagine lots of additional atoms that get skipped over). It can then emit a photon of one of three frequencies: the main transition (in which case the state vector goes back to (1,0,0)), a somewhat lower frequency (changing the vector to (0,1,0) with a 1% probability) or a really low frequency (changing the vector to (0,0,1) with a 0.01% probability).
A medium-frequency photon has a 1% chance of being absorbed at the next step, and a low-frequency photon has a 0.01% chance of being absorbed. If either of these get absorbed, they preferentially emit back to the state-- so if the state is (0,0,1) and it gets absorbed, there's a 1% chance of going to (0,1,0) and a 0.01% chance of going to (1,0,0).
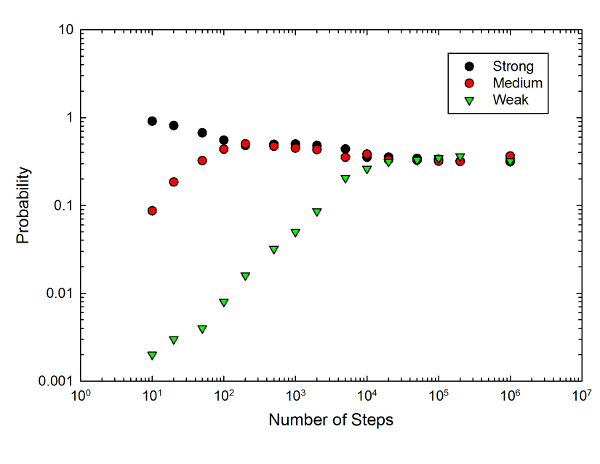
Then this process gets repeated a whole bunch of times (ranging from 10 to 1,000,000), and we record the final state. That process then gets repeated 1000 times to give a probability of ending up in each of the three states. All this repetition leads to the following graph:
 Results of the crude Monte Carlo simulation in the text.
The graph is a log-log plot (so each division increases by a factor of 10) showing the probability of ending up in each of the photon states-- the strongly absorbing resonant state, the medium-frequency state, and the weakly absorbing low-frequency state-- as a function of the number of absorption steps in the simulation.
A small number of steps corresponds to an optically thin sample-- the initial photon gets absorbed and re-emitted at most 10 times on the way through. As you would expect, this mostly leaves you with light at the resonant frequency, with a low probability of finding either of the other two-- about a 10% chance of the medium-frequency photon, and 0.1% of the low-frequency state. Those are about what you would expect-- with a 1% probability of emitting into the medium state, you you would expect about a 10% chance that this would happen in a set of 10 scattering steps.
As you increase the number of scattering steps, though, the chance of finding the lower frequency increases dramatically. By 200 absorptions, the probability of ending up in the medium state has shot up to about 90%, and after 1,000,000 absorptions there's a 60% chance of ending up in the weakly absorbing low-frequency state. This would presumably increase further for even more steps, but running through the loop a billion times took most of a lecture class period, and I don't have the patience to push it even further.
What's going on here? Well, it's the process described in the AJP paper: there's a very low probability of scattering into an off-resonant state, and once that happens, those photons are unlikely to scatter again. Which means that, over a long cycle of scattering, these highly improbable events inevitably push the state of the light toward the low frequency.
Now, there's a bunch of work to get from here to a black-body state (doing this right would need to start with a Maxwell-Boltzmann distribution of energies corresponding to some temperature, and include a lot more frequencies), but this illustrates the basic idea. Well enough for a blog post, anyway.
------------
(One technical note here: I dithered about what to use for the emission probability when an off-resonant photon scatters; this version of the simulation has it preferentially emit back to the same state that was originally absorbed (so (0,0,1) goes back to (0,0,1) most of the time, and only rarely to (1,0,0)). This is basically mapping a classical sort of frequency response onto the photon picture. The other thing you could do would be to treat it as a true absorption to the imaginary excited state, which would then emit with the same probability as the original state (so when a (0,0,1) state gets absorbed, it usually emits to (1,0,0) and only rarely back to (0,0,1). In that case, you see a similar sort of behavior, but the end result is rough parity between the three states.
(For completeness, that graph looks like this:
 Results of the Monte Carlo simulation described in the test, with a different emission probability.
(As I said, I dithered about this for a while; I think the first graph is the right way to do it, and it's easier to see a path from that to the expected result of a black-body spectrum. I am not 100% confident in this, though; there might be some way to get from rough parity to a black-body spectrum through the Maxwell-Boltzmann distribution of energies. Which is why this is a blog post, and not a paper written up to submit to AJP.)
(Though if anybody with genuine computational skills wanted to collaborate on doing a better job of this, I'd be happy to talk about that...)
- Log in to post comments
More like this

Very cool! The whole way through I was thinking I'd really like to see the real blackbody spectrum emerge out of this... maybe we should talk about that collaboration? :-)
Coming from a condensed matter background, it's a bit unexpected to see talk of discrete quantized states in a metallic conductor. The analysis you describe would seem right for me in the context of a very large volume of diffuse tungsten atomic vapour, but in a metallic filament the proximity of nuclei plays havoc on the Bohr model. Instead, we typically describe the electrical and thermal properties of metals in terms of an electron gas. In the basic undergraduate model it's quite successfully modeled in terms of a large collection of non-interacting fermions in a rectangular quantum well.
In that basic model, the Fermi sea fills up to a certain depth based on the electron density. At absolute zero you'd have a sharp boundary below which all energy states are filled, and above which all are empty. At non-zero temperature, we describe a diffuse interface with a width roughly the same as the Boltzmann energy width (1/40 eV at room temperature). Electrons that absorb thermal energy and are promoted into the nominally empty high-energy region are free to drop back into an effective continuum of unoccupied lower-energy states, emitting photons along the way. You don't expect to see sharp emission lines in this context.
Now, I would be interested in finding out whether your model reproduces a black-body curve for the case that it describes, but I maintain that this would be showing us the behaviour of a low-density atomic vapour, and I believe that you'd still see sharp absorption and emission lines due to edge effects at the boundary of the vapour cloud, as not all photons get a chance to pass into the main body of the cloud.
The little bit I remember from astro, concerning the formation of stellar spectral lines. At any given point in frequency and depth inside the atmosphere assume local thermodynamic equilibrium. Then the ratio of emission to absorption would be one, is the radiation field was the Plank distribution at the local temperature. So we can calculate the strength of the emission at a given frequency and beamangle by integrating over the optical depth, emission is delta opacity times the plank function, degraded by the absorption along the line of site (exp(-opacity). A back of the envelope approximation is to just use the Plank distribution at the temperature where the optical depth is unity. So if the bulb filament's temperature doesn't change too much with depth, you would expect a black body spectrum. Near line centers the emission is from very close to the surface. In more transparent frequencies the effective emission depth is greater. If you assume the radiation field at any given depth is near Plankian, then the scattered photons will also be (near) Plankian.