 Remember this summer when I was working on the course design for my new prep on Experimental Design and Data Analysis? We're now a month into the class, and while it has had its rough moments, I think it will ultimately be quite useful to the students enrolled in it.
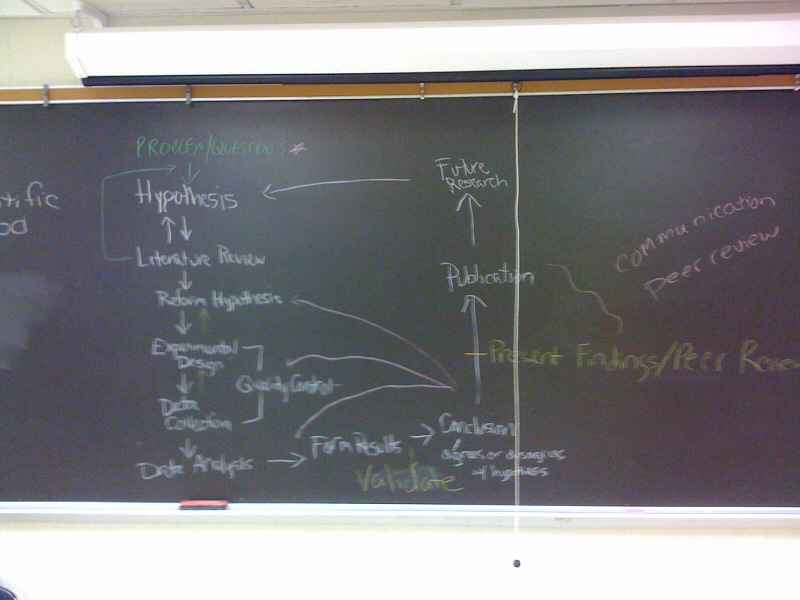
I'm currently avoiding grading, so I thought I'd take a moment to show the results of an exercise we did the first week. I gave groups of students two sheets of paper. On one I asked them to diagram the scientific method as they understood it. On the other, I asked them to diagram their experience with how scientific research is really done. After each group had come up with something, we composited the answers on the chalk boards in the classroom.
Here's what they came up with: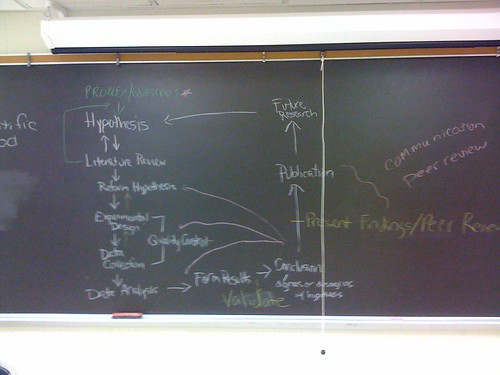
Want to help younger students think about problem solving and the scientific method? Give math literature to 1st graders in Indiana.
- Log in to post comments
Oh, the naivety of youth. Where, where do they have the all important step of soliciting funds?
There is no such thing as "the scientific method", and the notion that a description of how science actually occurs could be embodied in a flow chart is misleading.
I think this is a great exercise to get students thinking about how research is done. On the other hand, I'm afraid of two things: 1. I think "scientific research" is too general to be able to come up with a diagram that makes sense in all scientific domains and, at the same time, is specific enough to be helpful. 2. A diagram like this feeds the illusion that there is a recipe for research.
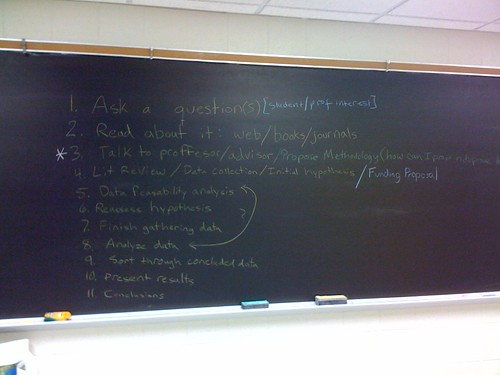
I assume that the second blackboard image is the scientific method as the students experienced it. That one is really surprising - the list of numbered points. Research in my domain (computer architecture - somewhere at the intersection of computer science and computer engineering) is never a straight line, but a complex graph with a lot of cycles, decision points and branches out of the main/initial plan. Some bits that I find important: there is always a back and forth between results and hypothesis; collecting data has many branches since it involves building some sort of system/simulator; there are always abandoned ideas; literature survey is parallel with main research and it's a thread that goes on at *all times*, irrespective of your research stage.
I assume CPP is just egging me on.
Ioana: Many of the students in the class are beginning graduate students with no real research experience. I was a bit distressed at the numbered list too, for many of the reasons you outline, but give them time.
Hi SciWo, you point out an interesting fact: beginning grad students have a certain image about how research is done which is *different* than how research is done in reality, but time (i.e., experience) will fix this discrepancy. Any thoughts on why this discrepancy in the first place? Do you think it's the role of the adviser/supervisor to help with this image early on?
Well, yeah. I am waiting for you to say that what they came up with is completely ridiculous.
Wow, fantastically linear! Sign me up for your discipline ;) I would also need to add a "Bang head here" sign and iterate early and often.
Even new grad students know that the process is not linear.I suspect that the list was linear and enumerated because that is the easiest way to show it on a blackboard with only two dimensions. Also many students are accustomed to brain-storming techniques where all the ideas are merely listed and discussion follows after ordering and priorities are established.
For some reason "11. Conclusions" cracks me up. I just imagine some first-year grad students imagining themselves successfully answering their question, brushing the chalk off their hands, and saying "that's the end of that chapter! On to the next question!"
I don't think I've ever had a project that "concluded". Just some that I got tired of publishing on after a while and ditched in favor of something else.
Consider that most pre-bac science education consists of drilling them on the "steps" in the scientific method so that they can regurgitate this info on a multiple choice exam. Hopefully, most aspiring scientists get a some exposure to the "real" method of getting some science done before grad school, but mileage may vary, and four years of exposure to this may not be sufficient to fully overcome 12 years of wrote memorization out of textbooks.
I'm actually fairly impressed with the fact that they've got arrows in multiple direction on their flow chart. They've been able to cast off some of the rigidity of the "observation-hypothesis-experiment-conclusion-DONE!" schtik already. (Yep, I still remember it.)
This post immediately made me think of one of my favorite PhD Comics:
http://www.phdcomics.com/comics/archive.php?comicid=761
ProFFessor?