
With Matthew Heberger. This is a version of a post from the blog "Pacific Institute Insights"
How much water is there in America’s rivers, and where is it? Perhaps unsurprisingly, people have little sense of how their local water resources compare in size to other water resources. “Is that a big river? A little river?”
One of us [Gleick] grew up along the Hudson River on the East Coast, and encountered rivers that seemed to be about the same size: the Susquehanna, the Delaware, the Potomac. Anyone living in the West working on water issues becomes more familiar with the Colorado, the Sacramento, the San Joaquin, and the Rio Grande rivers, but still may have little sense of how much water flows through these different river systems on any given year.
Now it is possible to visualize the nation’s water resources in different ways. At the Pacific Institute we have used a new dataset to create a scaled map of the major rivers of the contiguous 48 United States. We’re accustomed to seeing maps with what cartographers call proportional symbols: big cites get bigger dots than small ones, and interstate highways have a heavier line than county roads. In this map, rivers are scaled according to volume of water they convey. (Specifically, the width of a river segment on the map is proportional to the square root of its estimated average annual flow volume.)
Several things stand out: the massive flow of the mighty Mississippi and Columbia River systems; the paucity of major rivers in the western US, especially the southwestern US, where the only major rivers are the seriously over-tapped Colorado and Rio Grande Rivers; and the local importance of the Sacramento-San Joaquin Rivers in California, which serve the state’s cities and agricultural regions.
The data for this map come from the National Hydrography Dataset (NHDPlus v2) developed and managed by the US EPA and US Geological Survey, made available to the public and water resources community. And while we share many rivers with our neighbors, this dataset, unfortunately, stops abruptly at the Canadian and Mexican borders.
Another extraordinary map created using the same dataset was recently published by Nelson Minar, a Google software engineer. His maps show every river and stream channel identified by the National Hydrography Dataset project, including intermittent and ephemeral rivers that run dry for part or most of the year. The map is a delight to behold, but many of the blue lines represent mostly dry channels. “And you thought the U.S. had deserts!” quipped Popular Science.
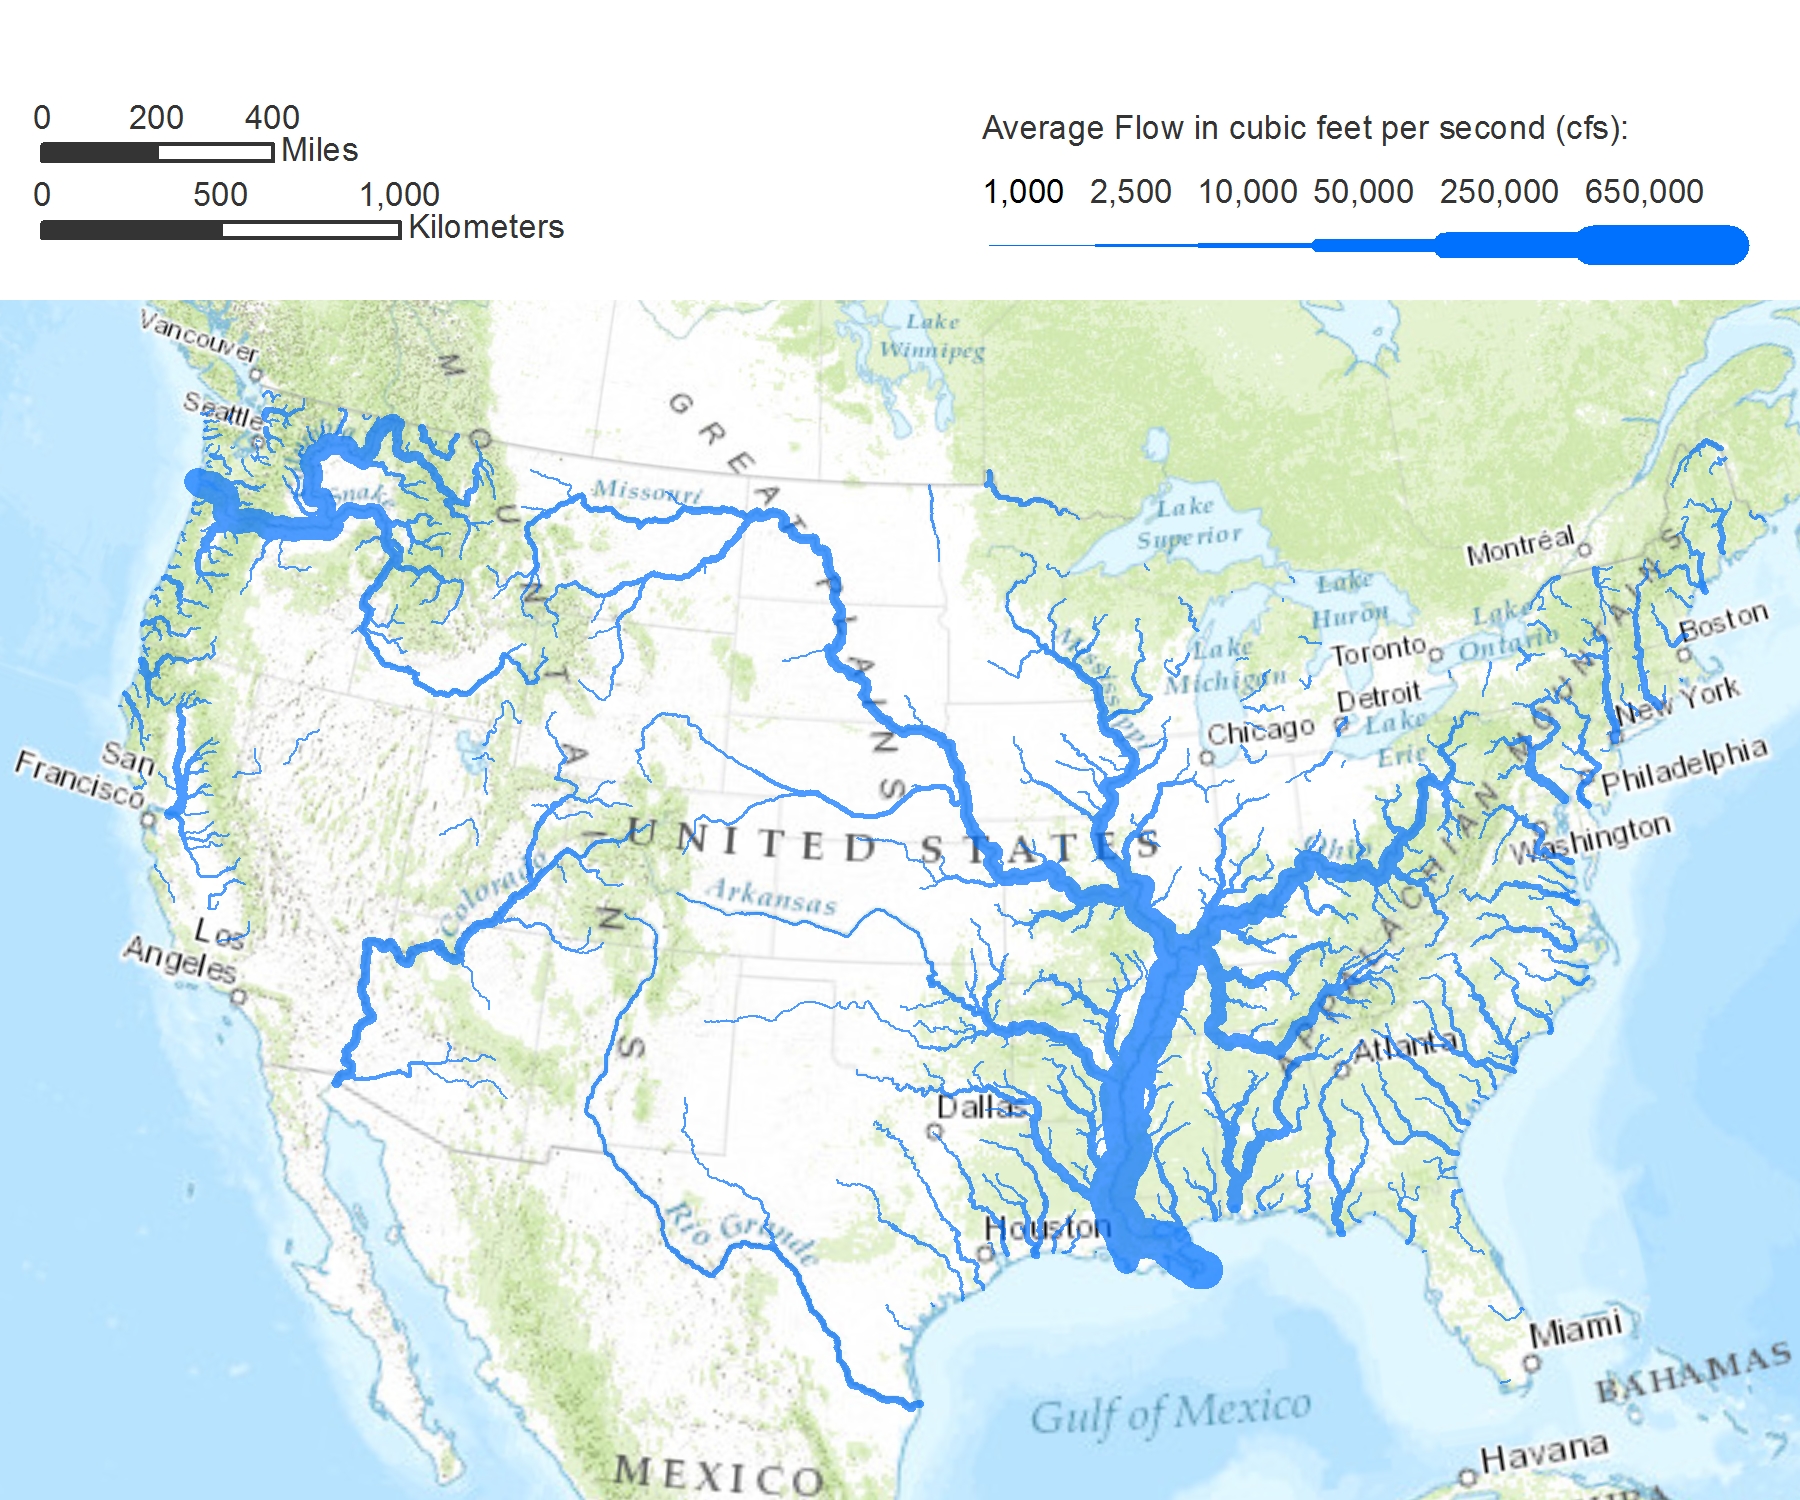 Caption: Major rivers of the 48 contiguous United States, scaled by average flow. The symbols drawn here have widths proportional to the square root of the rivers’ estimated average annual discharge. Only rivers with discharge above 1,000 cfs are shown. Data from NHDPlus v2. Background map by ESRI. Map projection: Albers equal-area conic. Prepared by Matthew Heberger (2013)*.
[Here is full size version of the map.]
![[Here is full size version of the map.]](http://www.pacinst.org/wp-content/uploads/2013/06/pacinst-americas-rivers-creative-commons.jpg)
Now if only you could see the Amazon, whose flow is more than ten times greater than the Mississippi. That would be more than a line on a map.
[Update June 26th: Some astute observers note that this map shows "unimpaired" or "modeled" or "virgin flow" runoff -- not the actual flows that reach their delta end points anymore. The Colorado River (or the Salt, Pecos, Rio Grande, and San Joaquin among others), for example, now dwindles down to nothing these days, due to massive upstream withdrawals and diversions. Thus, a complete map that showed actual gage measured flows would, for some of these rivers, have lines that dwindle down to nothing! That's a map for another post.]
I was curious about the great lakes connecting rivers like St. Mary's, St. Clair, Detroit rivers. I get that they are on the border, but they are shown I think, and seemed small. St. Clair runs about 180,000 cfs I believe.
Without it's Canadian tributaries, the Columbia looks kinda screwy too.
I live in MI, where we often note that Canada seems to have no weather according to some sources. It's a dark region, perhaps with dragons.
yes, as we note in the body of the piece, the data set is only for the lower 48 states of the United States. If and when we get the data for Mexico and Canada, we can redo North America properly and show the great rivers of Canada and the proper flows of the rivers we share! Thanks.