
It seems like everyone wants to talk about Tiljander. I don't, particularly, but you gotta give the customers what they want, so here is a thread to discuss it if you like. The comment policy still applies, but I'll be laxer. Comments incorrectly paraphrasing others will be harshly dealt with. Vague rantings unsupported by clear evidence or links, ditto. Repeating what everyone else has already said, ditto (this isn't a vote).
Some useful links you may want:
- Proxy-based reconstructions of hemispheric and global surface temperature variations over the past two millennia (Mea; includes supplementary info)
- McI's comment on Mea
- Mea reply to McI
- [Update: Supplemental Information for PNAS Article at Mann's website, plus updates
 Hopefully, people have read the Mea supplemental info where they say Potential data quality problems. In addition to checking whether or not potential problems specific to tree-ring data have any significant impact on our reconstructions in earlier centuries (see Fig. S7), we also examined whether or not potential problems noted for several records (see Dataset S1 for details) might compromise the reconstructions. These records include the four Tijander et al. (12) series used (see Fig. S9) for which the original authors note that human effects over the past few centuries unrelated to climate might impact records (the original paper states ''Natural variability in the sediment record was disrupted by increased human impact in the catchment area at A.D. 1720.'' and later, ''In the case of Lake Korttajarvi it is a demanding task to calibrate the physical varve data we have collected against meteorological data, because human impacts have distorted the natural signal to varying extents''). These issues are particularly significant because there are few proxy records, particularly in the temperature-screened dataset (see Fig. S9), available back through the 9th century. The Tijander et al. series constitute 4 of the 15 available Northern Hemisphere records before that point.
In addition there are three other records in our database with potential data quality problems, as noted in the database notes: Benson et al. (13) (Mono Lake): ''Data after 1940 no good-- water exported to CA;'' Isdale (14) (fluorescence): ''anthropogenic influence after 1870;'' and McCulloch (15) (Ba/Ca): ''anthropogenic influence after 1870''. We therefore performed additional analyses as in Fig. S7, but instead compaired the reconstructions both with and without the above seven potentially problematic series, as shown in Fig. S8.
So you can look at S8 - I've inlined it - to discover that the Tiljander series don't affect the overall result much.
[Didn't like this post? You want DenialDepot]
[Update: one thing that has puzzled some people is how little effect the Tiljander proxies have on the overall reconstruciton: see S8, which I inlined. But look at S9, and you'll see that the Tiljander proxies are remarkably flat before 1800. This would be consistent, for example, with recent non-climatic artifacts producing more variation than is naturally present. But it also means that the effect of these proxies on the total reconstruction pre-1800 is likely to be extremely slight (which explains fig S8). This is because the scale-this-proxy-to-termperature thingy is done on the overlap with the instrumental period -W]
That's well known that cash makes people autonomous. But what to do when one doesn't have cash? The only one way is to receive the personal loans and collateral loan.
It's great that we can take the personal loans and this opens new opportunities.
I received my first personal loans when I was 32 and it supported my relatives very much. However, I need the college loan as well.
The loan seem to be essential for people, which want to start their company. By the way, that's comfortable to get a secured loan.
One understands that our life seems to be not very cheap, nevertheless we require money for different stuff and not every one gets big sums money. Thence to get quick loan and short term loan will be a right way out.
Link building options at blog commenting services are efficient for ranking raising. Hence, I try to use it continuously and that really aids me very much!
I had a dream to make my own company, but I did not earn enough amount of cash to do that. Thank God my close colleague advised to use the loan. Thus I took the short term loan and made real my dream.
There is no other good way to receive A+ than to create the essay and itâs, besides, available to order the Shakespeare essays paper at the essay writing service scam.
You are so cool and your tought related to this topic is superb. Would you continue your investigation? We have to buy some dissertation thesis or dissertation from you.
Previously I was curious about SEO. Now I understand that blog posting is really essential for my internet site. Thence, I decided to turn to the blog posting services.
A doctoral level has to be really serious issue for anyone. What companies would support scholars in thesis example about this good topic making? I could advice to buy the thesis at the thesis writing service. We hope that the suggestion could aid you!
You are obviously, a professional of thesis title related to this good topic creating but if you are willing to opt for the thesis writing service, I will propose you to notice a professional item.
I would like thank you very much for the very hot information about this post! Moreover, you know, that the writing job onlne service will take this in the research papers.
Your thought about this good post is obviously brilliant and lots of students should take it for their thesis proposal. And some of people very often utilize the assistance of thesis writing service.
Selecting dissertations and the thesis, a lot of people can not notice such nice thesis project close to this topic.
From the tail of the prior thread ...
I'm a lay person who has looked at Mann et al (2008) (paper, SI, Comment, and Response), and who has followed the last bit of the discussion of the Lake Korttajarvi varve proxy series.
I had thought there was no dispute on the following five claims, but now I am not sure:
(1.) That Tiljander believes that the climate signal in the Lake Korttajarvi varve dataset is that higher local temperatures correlate to thinner, more-organic-rich, lower-XRD varves.
[Of my own knowledge, I don't know. You've provided a quote from McI - I'd rather see the original paper, but what you've quoted supports what you say. Mea quote "In the case of Lake Korttajarvi it is a demanding task to calibrate the physical varve data we have collected against meteorological data, because human impacts have distorted the natural signal to varying extents". That suggests to me that they didn't do the calibration -W]
(2.) That Tiljander cautioned that after ~1720, the Lake Korttajarvi varve dataset is likely affected by local-human-activity signals, leading to thicker, more-mineral-rich, higher-XRD varves than climate alone would produce.
[Mea quote "Natural variability in the sediment record was disrupted by increased human impact in the catchment area at A.D. 1720." - that is close to what you want to say, though not quite what you want. Do you think that Tiljander says anywhere that the proxy is useless for temperature after 1720? After 1800? -W]
(3.) That Tiljander has described two incidents of local activity that led to very thick, mineral-rich, high-XRD varves, in 1930 (peat ditching) and 1967 (bridge reconstruction).
[Assuming McI is quoting correctly, then that would be correct. It is also supported by S9, which shows strong spikes at what could easily be these dates. Those spikes will destroy correlation with the instrumental record and result in the proxy being de-weighted -W]
(4.) That the varve proxy was calibrated by Mann et al over a period (1850-1995) in which higher local temperatures were correlated to thicker, more-mineral-rich, higher-XRD varves.
[Not sure what you mean by this one. Do you mean, that the correlation (Tilj, Temp) for the period 1850-1995 is of such a sign that it implies that higher temp is associated with thicker varves? I think you do. The answer is, I don't know -W]
(5.) That Mann et al used the Lake Korttajarvi varve proxy in the reconstruction of the Temperature Anomaly record by applying the 1850-1995 correlations (thicker, more-mineral-rich, higher-XRD varves with higher temperatures) to the varve record spanning 200 AD to 1850 AD.
[Well I should certainly hope so. That is what they are supposed to do. I could quiblle your "used" - it is clear from S8 that the proxies hardly get used at all. This is what you expect from S9 -W]
W. Connolly [sic] and AndrewT, would you be willing to say which of these assertions you agree with, and where you disagree with them?
Thanks.
[You forgot "and those which you don't know about". How about you provide a link to T saying these things? -W]
Think you missed the link in 1.
[Thanks. Fixed -W]
It does not look clear to me why peat ditching and bridge reconstruction would give more minerals... got a link to the paper? And if they did would that not just give lower correlation to temp?
Magnus: here and here.
"Since the early 18th century, the sedimentation has clearly been affected by increased human impact and therefore not useful for paleoclimate research."
Links on Tiljander positions requested by W. Connolley (sorry about earlier misspelling). Result of a quick Google search, which lead readily to the primary literature for (1) and (2). (3) is a pers. comm., I believe.
As far as "You forgot 'and those which you don't know about'" -- I don't understand your meaning. If it is to imply that there are many, many things I don't know about, in paleoclimatology and other fields: agreed.
[Nope. The "you" in "you don't know" was you talking to me, so it meant me. If thats confusing enough. Or less cryptically: you're assuming a deeper level of study of the details of Tiljander than I have -W]
(1.) Nature of the climate signal in the Lake Korttajarvi varve dataset: McIntyre quoting Tiljander --
The amounts of inorganic and organic matter, form the basis of the climate interpretations. Periods rich in organic matter indicate favourable climate conditions, when less snow accumulates in winter by diminished precipitation and/or increased thawing, causing weaker spring flow and formation of a thin mineral layer. In addition, a long growing season thickens the organic matter. More severe climate conditions occur with higher winter precipitation, a longer cold period and rapid melting at spring, shown as thicker mineral matter within a varve.
(2.) Potential effects of local human activity on varves after ~1720: Mann et al (2008) SI, pg. 2, column 2 --
"we also examined whether or not potential problems noted for several records might compromise the reconstructions. These records include the four Tijander et al. series used for which the original authors note that human effects over the past few centuries unrelated to climate might impact records (the original paper states âNatural variability in the sediment record was disrupted by increased human impact in the catchment area at A.D. 1720.â and later, âIn the case of Lake Korttajarvi it is a demanding task to calibrate the physical varve data we have collected against meteorological data, because human impacts have distorted the natural signal to varying extentsâ)
(3.) Two incidents of local activity: McIntyre quoting Tiljander --
This recent increase in thickness is due to the clay-rich varves caused by intensive cultivation in the late 20th century⦠There are two exceptionally thick clay-silt layers caused by man. The thick layer of AD 1930 resulted from peat ditching and forest clearance (information from a local farmer in 1999) and the thick layer of AD 1967 originated due to the rebuilding of the bridge in the vicinity of the lakeâs southern corner (information from the Finnish Road Administration).
Magnus, the net effect is that this erroneous data causes the MWP and LIA to disappear. A secondary consequence is that the results are "upside down" in that thicker, mineral varves are correlated with higher temperatures.
But the big problem is that this mistake has lowered the magnitudes of the LIA and MWP.
[Looking at the picture, your assertions to not appear to be justified. What do you base your claims on? Pure thought? -W]
Upshot: McIntyre picked a nit that the authors had pre-picked getting on (from the date on the supplemental .pdf) two years ago.
Why am I not surprised?
McIntyre's tireless pursuit has been to show that the MWP was as warm or warmer than today, globally, not just regionally.
So "lower[ing] the magnitude of the ... MWP" to something lower than today's temps is unacceptable in the eyes of the CA faithful.
Of course it would help if JamesD made up his mind as to whether Mann's made them "disappear" (which the graph shows to be incorrect) or to be "lowered in magnitude" (as McI claims)...
bigcitylib #7 --
> Upshot: McIntyre picked a nit...
I don't think it's a small issue. Or, it's a small issue that leads to bigger ones.
The scientific literature ought to be correct. But nobody's perfect, mistakes will get in. When that happens, they should be acknowledged and fixed, so that the record--and our understanding of nature--is better than it was.
Scientists are people too, with career issues, emotions, beliefs, etc., just like everyone else. This can make recognizing and correcting errors harder than it would otherwise be.
If the Tiljander varve proxy was used incorrectly in Mann et al (2008), this should be acknowledged. If it wasn't, the authors should stick to their guns and defend that use.
If the five statements I offered above (#1) turn out to be true, it will be difficult to argue that the Tiljander series was properly used in Mann et al's reconstructions. How re-running the algorithms on Tiljander-less data would change the reconstruction, we can't say.
The main point of Mann's Fig. S8a (reproduced in the post) was to show such a reconstruction. However, I don't believe that the figure means what Mann et al (and our host) seem to think it means. Rather, it paints a picture that is either trivial, or too good to be true (if the Tiljander series was used upside-down). Reasoning behind this assertion in Cruel Mistress' comments.
[You'll have to explain here why you think this -W]
William,
Thank you for letting my posts through. I've never commented here before (I don't think) and I see others are having some trouble. It's nice to have an open discussion.
You are completely correct that Tiljander will have no material effect on Mann08 results. That's what's so surprising about Mann's response to this point. It is an absolutely minor difference but an obvious error. It's a little humorous, I can't figure out why they didn't say oops...sorry followed by an overly generous thank you to McIntyre with a microscopic change to the plot followed by a strong argument on other points.
Imagine how that would make the more substantiative arguments look. Mann needs a PR agent.
Anyway, Steve did a good job pointing out the flaw. I also agree with his other criticisms one hundred percent but those are more subtle.
AMac,
1) Why not lets retire this "upside down" thing. Everyone seems to agree that Stoat has the maths right.
2) Was the proxy used incorrectly? Steve MCs first argument was that it was used incorrectly because Mann was stupid, put in stuff upside down, and didn't know about Tijinder's caveats with respect to various proxies. Slam Dunk, as they say. Now, it is clear Mann et al DID know about the relevant data quality issues and tried to work them out as best they were able. Did they do a good enough job? I don't know! I'm not willing to accept Mcs word that they didn't. His argument hasn't even got to that level yet. Its still: Mann was so stupid he didn't even see a data quality issue.
...which is unsustainable.
bigcitylib #12
> 1) Why not lets retire this "upside down" thing...
I'm not sure what you mean. You'd have to be more specific on which maths you think everyone agrees that Stoat got right.
> 2) Steve MCs first argument was that it was used incorrectly because Mann was stupid...
You don't seem to like McIntyre. I don't think you'd like to be paraphrased with the same rigor that you employ in paraphrasing McIntyre. Might help the discussion if you quote him directly, instead.
Whether McIntyre's personal qualities are angelic or devilish, there's still the matter of Mann et al's use of the Lake Korttajarvi varve proxy series.
Evidence to date strongly suggests to me that they were mistakenly employed, in good faith. The reasoning behind this opinion have been presented on other threads, at Stoat and linked blogs. Seems to me that the paper has other problems too, see link in #10. But I could be wrong.
Amac writes:
"Evidence to date strongly suggests to me that they [the Lake Korttajarvi varve proxy series] were mistakenly employed, in good faith."
Yeah well, you are the guy demanding direct quotes, maybe you can provide some re all this evidence from other blog posts etc. To ME the Mcs argumenents and evidence all suggest that Mann et al simply didn't know that, for example, "human impacts have distorted the natural signal to varying extents" at Lake Korttajarvi. They insinuate that Mann et al simply missed all that stuff.
If you want to argue that, even though they didn't miss all that stuff, their method of dealing with it was inadequate, then go ahead. You won't get help from Mcs posts on the topic. They're of the "Mann's stupid (Al Gore is fat)" variety.
Anyone ever consider the proposition that Tiljander had it upside down? That may be what the reconstructions are saying. Just saying.
From McI himself in his latest post:
So, tempest in a teapot. As McI says and WIlliam's snippet from the paper shows, Mann was aware of the problems with this dataset.
McI has laboriously gone through the algorithm and believes he's determined that an spurious correlation causes the "upsidedownness".
Mann, on the other hand ...
Looked at what happens if you throw all the datasets that were questionable into the trash, determined it didn't have much effect, and was satisified.
So at best we have McI pointing out exactly *how* the Tijlander dataset that Mann was explicitly concerned about messes up Mann's algorithm.
That's reasonable. It's not worth the huge amount of "hockey stick smashed again" baloney we've seen from CA et al regarding Mann's paper once again.
If leaving out the troublesome datasets had drastically changed the reconstruction then surely Mann would've addressed this in the paper.
Anyone reading the paper will understand that, since Mann mentioned it.
Yeah, well, OK, one which, if we're to believe CA acolyte Jeff Id, "will have no material effect on Mann08 results".
I don't see any error by Mann, but rather shrugging off possible problems with a dataset because, as Jeff Id says, "there's no material effect". He didn't bother pursuing possible issues with that dataset but it really makes no difference. At best he can be accused of leaving some loose strings dangling, but big deal. It's the result that counts, and again, if we're to believe Jeff Id, the dangling loose strings "will have no material effect on Mann08 results".
Again, tempest in a teapot. Much ado about nothing.
I just read the Tiljander paper and came away with this takehome message: this is a lousy climate proxy. It may be OK before the 12th century, maybe, but there is extensive evidence of human activity in the area going back to pre-Roman times. This includes evidence of forest clearing and agriculture. She successfully identifies a known warm period around 800 - 900 BC and the MWP, but misses the LIA.
So upside down, inside out or right side up, this is a lousy proxy and should probably not have been used. Of course Mann anticipated these attacks and showed that it didn't matter whether he used it or not, leaving McI fuming.
bigcitylib #14 --
My response got sent to spam purgatory :-(
As far as what I think, try looking at the arguments in my comments in Stoat's "oh dear oh dear oh dear" thread and at the linked Pielke post. Many of the comments have a link or two.
Maybe without any URLs, this will go through.
W- Yes, deductive reasoning. If you remove the proxies where there is an erroneous amplified signal during the "calibration zone", then it should overwhelm the rest of the proxies ***to some extent***.
As far as my use of the term "disappear", that was an exaggeration, and I retract it.
Next question, if you remove these proxies from this study, which I think everyone agrees should happen, what is the effect on Figure S7?
JamesD, look at figure S8.
RN, I'm dense and don't get your point. I'll restate my question a different way:
I think it is pretty much settled that Tiljander is a "lousy proxy", and even worse, goes "inverse" during the crucial "calibration period", and thus should be excluded.
So if you throw out Tiljander, then you have to recalculate the dendro sensitivity analysis, and replot figure S7. What will be the effect? It needs to be looked at. S8 doesn't figure in to this question.
[Fig 8 shows what happens if you take out the 4 Tiljander proxies and 3 other potentially problematic ones -W]
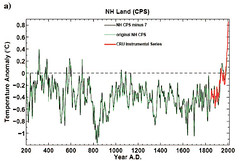
Fig. S8. Comparison of long-term CPS NH land (a) and EIV NH land plus ocean (b) reconstructions (full global proxy network) both with and without the seven
potentially problematic series discussed.
look ma no Tijander!!
anybody have a list of the "full global proxy network"?
Peter #23 --
You don't know that. Or, you haven't demonstrated it. Citation?
windandsea #24 --
The full list of proxies is discussed at the top of page 1 of the SI, "Proxy Dataset Details." It is present at the pnas.org website as a big excel spreadsheet. You can go through the spreadsheet and pull out the 15 northern hemisphere screened ultra-long-duration proxies that are depicted in Fig. S9.
However, I am unsure of the definition of the phrase "full global proxy network" in the figure legend. A search for "full global" only picks up figure legends plus a table heading on SI page 23. That table shows 1,209 "Full global proxies" for 1800-1855, slimming down to 25 that cover years 0 AD to 99 AD.
Hope that helps...
That's the whole point, and the CA-WUWT crowd will never except that Mann understood it.
Rather, they insist that this is what Mann 08 rests on.
Tch tch.
Idiocy. Pure idiocy. There are more hockey sticks out there than you can shake a goalie's glove at.
So if William's goal was to attract a horde of CA worshippers he's surely done that ...
Not complaining ... but it's interesting.
They so rarely venture out of their fantasy world.
dhogaza --
You seem well-informed on matters climactic, and more kindly disposed to Mann's work than to McIntyre's (as a guess).
Would you consider offering your take on the five claims concerning the Tiljander proxy series that I put up in comment #1? Maybe there are areas of agreement, maybe not.
Thanks.
From an earlier post:
".... this is a lousy proxy and should probably not have been used. Of course Mann anticipated these attacks and showed that it didn't matter whether he used it or not, leaving McI fuming."
This comment includes two misunderstandings with the use of Tiljander data.
First: The lake sediments are well known. The methods of interpretation were developed in the 1990's. Nowadays we can measure when the climatic signal is contaminated by other things. Thick/thin layers is only one parameter.
Second: The algoritm by Mann is incorrect (it was shown on Climateaudit). So, it is not enough to say that leaving out Korttajärvi doesn't matter. The error in Manns algoritm is still there although data is changed.
Larry Huldén
Finnish Museum of Natural History
Larry, you need to show us where Mann is incorrect not just state that he is.
Regarding the upside down that is as far as I can tell only a math thing and if CA was right on this he would be all over it showing what Mann did wrong... I have seen nothing of that... any one got a source for how it is possible that "Multivariate regression methods are insensitive to the sign of predictors." is incorrect?
And lets say that we remove the data from 18th century... from that time on we got quite much ells that tells us what has bean going on with the temperature... This seams like a storm in a glass of water, as usual when discussing hockey sticks.
To clear up a few things:
1) Yes, whenever McIntyre say that 'Mann used it upside down', then he means that Mann's [B]algorithm[/B] uses it upside down. And the semantics of this are irrelevant - Mann is responsible for his algorithm. If he codes up a program that as part of its operation will invert Tiljander against the correct physical interpretation then he is using it upside down.
2)Yes, it doesn't matter what orientation the data has when [B]input[/B] into the algorithm, since we are disussing an algortihm that will flip the series based on either an a priori sign or based on a correlation to the temperature record. This is not contested.
3)Mann's CPS assigns the incorrect a priori sign to Tiljander and uses it upside down.
4)Mann's EIV correlates the contaminated spike present in Tiljander with temperature during the calibration period, inverts it, and uses it upside down during the reconstruction.
3 and 4 are indisputable facts. We have the code.
Fig S7 shows the recon without NAS-rejected bristlecone pines, Fig S8 without corrupted sediments - does anyone know where I can see a clean reconstruction without either of these elements?
Magnus Westerstrand wrote:
Larry, you need to show us where Mann is incorrect not just state that he is.
Regarding the upside down that is as far as I can tell only a math thing and if CA was right on this he would be all over it showing what Mann did wrong... I have seen nothing of that...
Well, if you want to see "CA showing what Mann did wrong" simply read this: http://www.climateaudit.org/?p=7599#more-7599
Magnus Westerstrand #29 --
Same request of you as of dhogaza (see #27) and our host, if you're willing.
With those five claims, I try to break down the idea behind "any one got a source for how it is possible that 'Multivariate regression methods are insensitive to the sign of predictors'" into smaller parts.
Maybe there are areas of agreement (albeit limited) between those who accept Mann et al's treatment of the Lake Korttajarvi varve proxies, and those who don't.
The basic problem that Tiljander shows up is that the Mann methodology tends to mine for hockeysticks. In all these papers Mann & co start of with dozens if not hundreds of possible proxies which they then check to see whether they correlate to (part of) the instrumental record. The ones that don't are thrown out and then some additional pricessing goes on the rest to get a single line out of the combo.
If Tiljander were not upside down it would be discarded
[Wrong. You really haven't been paying attention. *The sign of the input proxies doesn't matter* -W]
as it would not correlate with the instrumental record. This is the same as what Mann shows in s8. The point is that what we have here is a bunch of proxies that after processing all look like the instrumental record for the last century or so.
I refer you to http://rankexploits.com/musings/2009/tricking-yourself-into-cherry-pick… and a selection of posts at Jeff Id (comment 11)'s blog
Francis, you got it upside down. We have a 150 year INSTRUMENTAL record, which shows a strong increase. If you have a possible proxy that extends further back, it better respond to the temperature, local or global as appropriate, increase over the last 150 years so you can calibrate it. If it simply sits there and does nothing, whatever it is, it ain't a proxy for temperature. Mann is mining for temperature proxies and tossing the ones that don't respond.
Michael, thanks for pointing the info out. I actualy do not see the any prof of my question there... just had a quick look. Will try my best after work!
I have been pointed to this thread by a friend who said, "Look, look! They (climate scientists) are blatantly misusing studies to justify their hockey stick". As a responsible citizen who rightly worries about climate change I need to be able answer him if we are to hold back the growing tide of skepticism. So for the love of god, will someone please answer AMac's 5 questions before Saturday night or my AGW denying friend will be insufferably smug and I will be buying the drinks.
Thank you
Re bigcitylib ## 7, 12 & 14
If you think that Steve McIntyre didn't know that Mann et al knew about the problems with the lake sediments and that all that's happening here is that Steve M is two years late picking a nit that Mann et al had already picked then you haven't been following the story. (I'm being polite.) Here, for example, is Steve M commenting on a comment posted to his blog on 2nd October 2008, two months before he submitted his 'bizarre' comment on Mann 2008 to PNAS: 'Again , be careful in what you're saying is flipped. Tijlander [sic] inverted the series for interpretation; Mann didn't. So it's not that he had to manually do something to get a wrong interpretation. This could have happened by not paying attention. However, in the SI, he quotes from Tijlander et al - it's the only study that he actually quotes in the entire SI, so he could hardly have [b]een unaware of the issues here.'
Surprised yet?
Taking another round and I am still where I started... you try the proxy against change in measured temperature... Then you use it with the others when trying to reconstruct global T changes... If the proxy is problematic you make reconstructions without it... where exactly did Mann go wrong? maybe he should have ignored it completely? However that would have meant some one could say that he left that one out on purpose... this still seams like a storm in a glass of water to me...
William-
Will you be answering AMac's request for your views on his five questions in #1 above?
[Yes -W]
Not answering gives a strong impression that you do not want to resolve this question based on the facts of the matter. See #37 above.
If you choose not to respond to his very fair questions, could you explain why?
Vinny,
Then what IS Mc's point? That even though Mann knew about the proxy issues, ran his numbers with AND without them (hence without anything being "upside down") for that very reason...what? At CA you hear people running around a bit demanding what "S8" RELLY shows. Is Mc and co. going to flounder about like this until, perhaps by accident, somebody finds something hes not quite totally wrong about, and then claim victory?
AMA, Same question to you. What is wrong with Mann's procedure? He gives you the results with the proxies in question in, and then out. They both look the same. Where does Mcs conspiracy go from here?
MichaelG #36 --
I hadn't asked Eli Rabbett to offer his take on those claims :-)
That said...
Eli Rabbett #34 --
You seem well-informed on paleoclimate issues, and well-disposed to Mann et al's article.
Would you consider offering your take on the five claims concerning the Tiljander proxy series that I put up in comment #1?
- - - - -
me no understand #37 --
Maybe you and your AGW-denying friend can split the tab on Saturday? The handling of the Lake Korttajarvi varve series is a teeny issue. It's not going to settle any of the Big Questions.
And I'm trying to break it down further, to the level of the point that brought me here. That was our host's post Oh dear oh dear oh dear oh dear, commending a comment at Roger Pielke's blog, where AndrewT had written "'Multivariate regression methods are insensitive to the sign of predictors'. Mann et al seem to be saying their methods are invariant to the data's orientation - perhaps to linear translation? - anyway it means the data can't be upside-down."
In theory, one might approve of Mann's handling of the proxies and still be an AGW skeptic, and vice versa.
bigcitylib #40 --
>AMA, Same question to you. What is wrong with Mann's procedure?
(Assuming that I'm AMA) Please refer to my comment #13 supra. I take it that our host hasn't released my earlier linky version of that response because it's essentially redundant.
> Where does Mcs conspiracy go from here?
I don't know how to say this more politely. You aren't very good at paraphrasing opponents. Since I haven't opined on a "Mcs conspiracy" (to my knowledge), this strikes me as a loaded question.
Big city Lib,
You don't seem to be paying attention. The sensitivity question Steve Mc and others are asking is what happens when you leave out both the questionable lake varves AND the bristlecones.
Let's take a look at the two issues with Tiljander and upside-down usage.
Let's switch Tiljander proxy to a century scale to explain the issues. Looking at the proxy in Tiljander's paper,
the century values from 0 to 2000 are approximately
65,60,65,70,70,75,70,65,65,80,50,85,55,75,70,70,75,70,85,95
Warm centuries are the 1000s and 1200s, with the intervening 1100s having the coldest period.
Now, the initial confusion could be that here, lower numbers mean higher temperatures.
Now issue number one is that the last two data points do not represent cooler temperatures, but other factors.
As it is, if you want to use this proxy, you should cut off the last 200-300 years, and use the rest with lower numbers representing warmer temperatures.
Instead Kaufman, prior to his correction, cut off the last 200 years, and used lower numbers to mean cooler.
Mann used lower to mean cooler, and kept the last two hundred years, so the unrelated to temperature lower numbers of the last 200 years correlate with the temperature record.
The last 200 years show cooling in the proxy, but Mann has flipped it upside-down so it shows warming, and the warm parts historically are now interpreted as cold.
[If the proxy is unreltaed to temperature over the last 200 years then it is unusable for Mea's method -W]
Contra Greg, it is in dispute whether the algorithm will flip a proxy. Some of the proxies are categorized so that the algorithm will not flip them. They are fed in with the 'correct' orientation, and Mann has done this upside-down.
[No -W]
W. Connolley --
Some of the earlier comments in this thread are now differently numbered. In my comment now numbered 23 (October 29, 2009 11:21 PM), I responded to Peter #23 (now deleted) and windandsea #24 (now 22).
This is your blog, of course, and it is your prerogative to set any comments policy you wish, of course.
[Yes, and I said so -W]
I don't recall earlier comments as being particularly noxious, or worse than some later remarks.
My third comment here was snipped as irrelevant, but its passing could be mourned. As you know, that was fine by me.
I dislike the idea of looking like an idjit in the ScienceBlogs archives because I rebutted or built on an earlier argument that no longer exists.
[Thats just tough I'm afraid. One solution is to slow down a bit - there is no great hurry about any of this -W]
If leave-no-trace pruning is common practice, I'll say less at this forum. Of course, that might be a bug, or a feature. :-)
[On reflection, simply deleting the nonsense is a mistake, since it throws those like you who number stuff. I'll update the comment policy -W]
Eli - you are on to something, but the INSTRUMENTAL RECORD they use is a zonal mean construction (sparse, but I was glad to see this was the case instead of a larger reconstruction). What you say is the equivalent of wanting to throw out individual "thermometers" as being untrue if they don't agree with the "larger" reified construction. This seems inherently wrong-headed. All of the initial data from the ground up is what is being looked at.
I can see the argument that the upside-down-ness doesn't matter because if you feed it in upside-down, the algorithm will see a negative correlation to temperature, and flip it back to get the right orientation. That doesn't work in this case because the post 1800 negative correlation is unrelated to temperature.
[Argh, please read what is above and don't just repeat. *If* the post 1800 proxy is unrelated to temperature then it is useless for Mea's method, and it matters not one whit which way up it is. Snip -W]
The Tijlander proxy was determined by specialists to have one orientation. Mann, however, used a computer algorithm to determine the orientation and this algorithm was insensitive to the particular properties of the varve proxies and of contaminated proxies in general.
There are a couple of obvious issues wit this:
a) why did Mann use a computer algorithm to determine proxy orientation on proxies whose orientation has been determined by specialists?
[You're not reading and you're not thinking. The Mea algorithm is *insentitive* to the sign of the proxy. Please don't proceed any further until you've understood what that means and why it makes your question irrelevant. Snip -W]
dhogaza writes:
"McIntyre's tireless pursuit has been to show that the MWP was as warm or warmer than today, globally, not just regionally.
So "lower[ing] the magnitude of the ... MWP" to something lower than today's temps is unacceptable in the eyes of the CA faithful."
The problem for the McIntyre crowd is that observations are making their political case more difficult. We're just wrapping up a decade that is nearly 0.2 C warmer than the previous decade, when the earlier multi-proxy reconstructions were done. In addition, recent studies further reduce uncertainty bounds in the MWP. Therefore, conclusions like "the most recent decade is warmer than..." become stronger.
It's not a surprise that McIntyre's recent charges once again is somewhere between zero relevance and negligible implication.
So perhaps the issue is the choice of algorithms? I think everyone can see that the algorithm did what it did and didn't care about inversions. OK, fine. But why is such an algorithm that doesn't care about inversions appropriate for this study? It would seem that it is not.
[It seems quite clear that not *everyone* doesn't care about inversions - look over in RP land. There are lots of issues here and if you don't pause to think you'll get confused. As far as I can tell, Mea's algorithm doesn't care about the input sign of the proxy *and will produce perfectly good results whichever way up you feed in the input*. However, it will not produce anything useful from a proxy that has no correlation with temperature during the instrument/training period, or from a proxy whose response changes substantially before/after training (proxies are supposed to be linear or close to; it is the job of the proxy author to make them so). If by "This study" you mean, "reconstructiong the NH temperature for the last 1kyr" then the answer is obvious; remember, there is far more than Tiljander in this mix. If you mean "for using the Tiljander proxy" then you may well be right -W]
Looked a bit for it (not much I am willing to admit) but did not find any numbers for how well the Tiljander data correlated with the instrumental record... any one?
If the two questionable proxies are irrelevant to the robustness of the study results, then why not show a single result with both removed instead of showing two alternate results with each questionable proxy individually removed?
[Incivility removed. Answer: I don't know. I could speculate: there are only so many combinations you can display, and it isn't clear why this issue which appears of such obsessive intrerest to McI is of interest to the rest of the world. You could try asking him to do it, if you care -W]
What I see in this thread is people "violently agreeing" with each other.
WC says "*If* the post 1800 proxy is unrelated to temperature then it is useless for Mea's method, and it matters not one whit which way up it is". This is correct and describes the cause of the problem.
SM describes the series as being used "upside-down". This is the result of the proxy being calibrated on a period which is "un-related to temperature". Maybe the wording is not perfect, but it is clear.
Does it matter? I'm going to ignore WC's *if* as it seems to be well established that the proxy is unrelated to temperature in recent times, which is why Kaufman didn't use the recent portions in his study. Mea used a "remove one" sensitivity test. Now that one proxy is shown to be defective, there is no remaining sensitivity test to the other proxies, and so the sensitivity test needs to be re-done. Only then can we judge the significance of this problem.
Here are my answers to the five:
Yes and no. This is true for at least the 800- 900 BC warm period and parts of the MWP (I prefer her term of MCA, it better describes what was going on globally). However there are other periods where this does not seem to hold true (the LIA which isn't picked up in her study). There also doesn't seem to be a real relationship here, it is more like these periods were sussed out as a contrast to what was happening in the periods surrounding them. There seems to be a real non-stationairity problem with this particular proxy.
Yes, and Mann quoted this in the SI as reason to perform his analysis with this set of proxies dropped.
See answer to 2.
Yep, and this is part of the reason why this is a lousy proxy. But, it is diffcult to tell if this is entirely due to local anthropogenic influences. If you look at the precipitation data provided in the paper you will see that over the 20th century there has been a rather steady increase in precipitation which might at least partially account for this.
Yes, but see answer to 4.
As I have stated elsewhere, after reading the paper I do not think that this proxy set is great. Tiljander tried mightily to interpret it as a climate proxy, but was only partially successful in doing so. She did not try to calibrate to local temps (for obvious reasons). I suspect that the only reason they (the four Tiljander proxies) passed screening is because Mann used a looser criteria (P < .1) than would normally be used. Still, the inclusion or exclusion of these proxies had no effect on the conclusions of the recon.
Still these proxies do seem to contain some apparently good information from pre-MCA eras. Long potential climate proxies like this are hard to come by (there were only 25 in the whole data set) so the temptation to use even problematic ones is high.
WMC at October 30, 2009 2:38 PM --
> However, [Mann et al's algorithm] will not produce anything useful from a proxy that has no correlation with temperature during the instrument/training period.
I believe that for the measures in the Lake Korttajarvi varve series, the algorithm detected a correlation with temperature over the 1850-1995 calibration period, as all four passed the screening process (pg. 13254 col. 1 and SI pg.2 "Screening Procedure").
As a test of the ruggedness of the algorithm/data combination, one could pick an earlier calibration period for Lake Korttajarvi. For instrument records, one could substitute a subset of the screened long-duration proxies (Fig. S9) or something similar. The best periods would have a wide range of temperatures, like 1600-1700 for the end of the Little Ice Age.
If the procedures in Mann et al (2008) worked as designed, then the Northern Hemisphere Temperature Anomaly calculated from Lake Korttajarvi (calib. 1850-1995) should look similar to the one calculated from Lake Korttajarvi (calib. 1600-1700). The graph would resemble Figs. S7a and S8a, except that the two calibration periods would be blanked.
If the sign of the varve-signal to temperature correlation derived by the algorithm was positive for one calibration period and negative for the other, it would follow that the two Lake Korttajarvi traces would look very different from one another.
[Politics deleted -W]
Rattus Norvegicus,
Those are really well thought out remarks. Can I be in your journal club?
Thanks for the detailed interpretation of the data Tiljander provides in her original paper.
Based on what you say of the varve record's weakness during the Little Ice Age, I'd amend my 4:50pm proposed experiment, swapping in the onset or conclusion of the MWP/MCA.
our host says in an inline response at comment 44:
[If the proxy is unreltaed to temperature over the last 200 years then it is unusable for Mea's method -W]
I think you've finally got it. Tiljander says the proxy is corrupted from 1720ish and corrupt in a way that human intervention causes drastic implied cooling. If you invert Tiljander then from 1720ish you get a sharp warming which more or less matches the temperature record. This then causes the Tiljander proxy to claim that the 1600s in the LIA were warmer than the 1200s in the MWP. This is wrong.
[Nope. See S9 -W]
At various points our host writes: The Mea algorithm is *insentitive* to the sign of the proxy
Which is why many think the algorithm is stupid. See explanation above. The algorithm only keeps data that show a more or less monotonic increase over the last century or so. The sign insensitivity is simply that it automatically flips any proxy that decreases monotonically too.
[Oh dear. You really don't understand. A proxy that doesn't repreoduce temperature isn't useful; or rather, isn't actually a temperature proxy. Which is why they need to be calibrated over the instrumental period -W]
The reasn why Tiljander is important is that it shows quite clearly that the Mann algorithm is purely mining for these late chronology trends and not paying any attention to anything furhter back in time.
That's not what McIntyre says. McIntyre says it's simply due to a spurious correlation - the problem is with the proxy, not the algorithm.
Take a little time out from posting here and go educate McIntyre, as obviously you're sure he's wrong.
As far as Mann using a problematic proxy ... well, he mentioned it was a problematic proxy and dropped it out to see what effect it had. Nada. Non-issue.
Even McIntyre úber-acolyte says the issue isn't the effect on the reconstruction, but says that the issue is (now) Mann's unwillingness to say "I made a mistake".
(Mann didn't, but at least we're getting progress from at least one Mcintyre fanboy ... the hockey stick is real, not smashed, they just don't like how he got there, i.e. showing that the problematic proxies didn't matter.
It would be nice if the CA hockey stick smashers could get on the same page, amongst themselves and of course in line with McIntyre (who some, at least, apparently don't understand beyond "Mann's wrong!")
Eli:
"If you have a possible proxy that extends further back, it better respond to the temperature, local or global as appropriate, increase over the last 150 years so you can calibrate it. If it simply sits there and does nothing, whatever it is, it ain't a proxy for temperature. Mann is mining for temperature proxies and tossing the ones that don't respond."
This is problematic - let me explain.
Let's suppose we have what we think might be a temperature proxy - say, tree rings. We toss a bunch into the magic box, and it pops out saying that certain trees are and certain trees are not. We toss the ones that are not and create our reconstruction. All good, right? Wrong. Very wrong. In order to estimate if the ones we (or in this case, our magic box) picked really are responding to temperature, we'd need to get a handle on how many we kept versus how many we threw away and what the chances are that some other factor which we haven't considered created the response in the "responders" by sheer happenstance.
Furthermore, you had better have a plausable physical mechanism for why a proxy would respond to a regional or global climate signal rather than a local one - it makes no sense to suggest that, eg, tree rings respond to a global signal when they are demonstrably affected by local signals (the plants in my back yard here in Australia do not care how much snow there is in Siberia unless you can show how snow in Siberia affects, say, precipitation in Sydney)
Neil,
Do you have any prof that the top researchers miss any thing of the very basic stuff you write about in #61 ?
dhogaza @ 10/31/09 12:30am --
You offer a spirited defense of Mann et al (2008), and have directed some sharp remarks towards critics of Mann's use of the Lake Korttajarvi varve proxies (e.g. to FrancisT here, to Roger Pielke in the earlier Stoat thread).
In addition, your comments at RealClimate.org show that you are very knowledgeable about paleoclimate reconstruction, whether or not you work in this field.
For these reasons, I hope you will offer your views of the five claims in Comment #1, concerning Mann's use of the varve record.
I believe the discussion profited from Rattus Norvegicus' remarks (upthread 10/30/09 4:16pm), and I think yours would be insightful, as well.
In particular, you allude to Figure S8a ("[Mann] mentioned [the Lake Korttajarvi varve series] was a problematic proxy and dropped it out to see what effect it had. Nada. Non-issue."). It seems to me that one's analysis of that important figure will be informed by one's understanding of the varve-based proxies, and Mann et al's handling of them.
We probably shouldn't get bogged down in Briffa etc here, but no. This isn't how it's done - only MacIntyre "tosses a bunch into the magic box".
Researchers understand we have a rich body of knowledge regarding tree physiology which enables them to, with some (though not absolute) confidence, differentiate trees that respond to temperature vs. other limiting growth factors.
One should be careful of criticizing work that one does not understand. I'm sure you got this directly or indirectly from MacIntyre, so it's not you I blame.
dhogaza,
Since as you affirm...
...wouldn't it be most appropriate to select trees and series based on said physiology, and include the complete data set from said trees and collections?
[Cut. The rest of this was a number of vague, unreferenced, useless assertions. Please provide links to give us some clue what you mean -W]
In comment 52, Dr. Connolley says that he doesn't know why it would be of interest to see the effect of removing both of the questionable proxies from the reconstruction at the same time
[Cut. No I didn't. Please don't misrepresent me. Have another go, and get it right -W]
[Cut. Provide refs not vague assertions -W]
[Cut. Irrelevant -W]
>As far as I can tell, Mea's algorithm doesn't care about the input sign of the proxy *and will produce perfectly good results whichever way up you feed in the input*.
Now you've lost me. What is the 'Mea algorithm?'
[Trimmed. "Mann et al." -W]
dhogaza:
"We probably shouldn't get bogged down in Briffa etc here, but no. This isn't how it's done - only MacIntyre 'tosses a bunch into the magic box'.
Researchers understand we have a rich body of knowledge regarding tree physiology which enables them to, with some (though not absolute) confidence, differentiate trees that respond to temperature vs. other limiting growth factors."
If the Tiljander data proves anything, it is this: When Mann uses proxies, he largely ignores the rich body of knowledge that you refer to, and simply tosses them into his algorithm. That is precisely how he wound up using a proxy that was dominated by non-climactic information.
It also explains a host of past Mann errors. (i.e. the rain in Maine falls mainly in the Seine). These types of mishaps are the result of somebody throwing a bunch of data at an algorithm they have devised, and not paying very much attention to where the data has come from.
And it's also why he warned that there were possible problems with the proxy, and why he did reconstructions with and without said proxy, showing that it had, as JeffId says, no substantial effect.
In the top post, Stoat excerpted part of the paper that proves your statement false regarding the Tiljander dataset. I wonder what you mind find if you read the entire paper?
Mann has fooled you
[Nope. Sorry. Not interested in a re-run of the Hockey Stick Wars -W]
@72
Where's your data and graph to support this?
Jason wrote (10/31/09 2:18pm) --
Huh? The SI PDF file doesn't have any date information that I can see, but the page with the online version of the main article and SI clearly states "Published online before print September 2, 2008". The paper itself reads, "Communicated... June 26, 2008 (received for review November 20, 2007)." It was in the September 9, 2008 issue of PNAS.
What is the basis for your claim that the SI was recently altered?
[Oh dear, I cut all of that from Jason's comment, since I really don't want a tedious re-run of the Hockey Stick Wars -W]
[Deleted. No information content -W]
A message to all.
It looks to me as though people have largely run out of original and interesting things to say on this topic, but haven't run out of the desire to say things.
In particular, I don't want this to turn into another re-run of the Hockey Stick Wars, and won't let it.
62 & 64:
Would it not be appropriate for the authors of the paper to state any a priori selection criteria ("screening") and also the reasoning behind their use of correlation selection? Surely it is not my job to prove that what they did was wrong, but their job to show what they did was right? I may or may not agree with their choices, assumptions and reasoning, but they should show it so that all interested parties can assess it for themselves. They may be right for all I know, but the point is that it's their job to convince me (well, others, anyway), not my (others) job to second guess what they did and why.
WMC --
Before you close the thread (if that's what you're thinking at 6:02 PM), it would be great to get some responses to the five claims I proffered in Coment #1. So far, only Rattus Norvegicus has weighed in.
[I replied to you there some time ago -W]
Some people have been free with criticisms of others' faulting Mann et al for their handling of the Tiljander varve series. But I don't see how it is possible to make such a critique in an informed way, without having views on the basic meaning of that Tiljander varve series, as it relates to Temperature Anomaly Reconstructions -- the subject of the Mann et all paper, after all.
The meaning of Figure S8a--which you reproduced in this post, thanks--is difficult to divine. Again, how one interprets it depends largely on what one thinks of the Tiljander varve proxies.
[I doubt it -W]
Taking us back to the five claims in Comment 1.
I hope AndrewT will weigh in. It was his criticism of Pielke that was the subject of the prior thread (Oh dear oh dear oh dear oh dear) and the springboard for this one.
I hope dhogaza will offer his opinions on the five claims as well; s/he has been free with criticisms of Pielke on similar grounds. And his/her reflections would be valuable in their own right, I suspect.
Also Magnus Westerstrand, and others.
In my opinion, Figure S8a is critical to the interpretation of the entire Mann et al paper.
W,
You wrote
OK, let's be very concrete.
I said
Let's take an almost-random selection of recent papers (whatever I can easily find online :)). My method:
* Find a proxy paper
* Search it for the criteria they used in selecting data sets
* See if all dataset selection criteria are based on the physical principles (which would be entirely appropriate), or are based on the data itself (which sounds reasonable but is actually a circular logic.)
* If a data-based selection found, stop and add to the list below.
* If no data-based selection is found, add to the list and note.
(I make no judgment on any other aspect of these papers. I'm sure they all represent great work by great people!)
There's three examples, from the first three papers I've checked. I think Wilson has a newer paper; it's the one that first got me thinking about this. Didn't find the link and I'm out of time.
I trust these specific referenced examples give you something to consider. In every case, data sets were excluded not because of physical (metadata) criteria but because of the qualities of the data itself.
As I noted above, I have no bone to pick with these particular authors. This is an apparently common practice in climate science (and is in accord with Esper's famous quote.)
It is a practice I find nowhere else in science. (Sorry, can't give you a "reference" for that, since it is rather hard to prove a negative assertion! I would be grateful for references to a set of three respected papers in other sciences where data sets were excluded for similar reasons.
In what other field do scientists say "this data set does not show what we want to show, so we excluded it."
[What you've done here is prove that you don't know how the reconstructions are made. You need to go all the way back to the beginning - probably at RealClimate, or one of the early Mea papers - and find out how and why the reconstructions are done -W]
Amac I know nothing about lacustrine sedimentation and din't have anything I could add to William's initial response.
As a more general answer - I've long liked the ideas of "reproducible research" people so I had some sympathies for SM - in that his "auditing" should be easier (not why I like "reproducible research" though) . Browsing Briffa's responses to SM has removed any sympathy. The serious accusations of misconduct generated by SM & friends, were clearly baseless. Briffa's characterization of them as hysterical and defamatory seems accurate. I assumed buried in SM's lYamal blogging there were legitimate scientific points - but perhaps molehills rather than mountains. Reading Briffa it seems that SM found not even molehills - at least as much as somone who wouldn't recognize a Larch if it fell on them can tell.
I would expect there are molehills to be found in in a work like Mea, and you'd expect SM-style analysis would come across them, but I'd be very cautious about accepting SM's claim - and I'd expect the tiniest molehill to be made out as a mountain.
It is a practice I find nowhere else in science. (Sorry, can't give you a "reference" for that, since it is rather hard to prove a negative assertion! I would be grateful for references to a set of three respected papers in other sciences where data sets were excluded for similar reasons.
In what other field do scientists say "this data set does not show what we want to show, so we excluded it."
MrPete, I'm afraid you don't know as much about science as you would like to think. There are many examples in the study of turbulent flows for example, also in biology, for instance Hartwell's work on temperature sensitive mutants.
W - As stated, I was only quoting the first data-based criteria found in each of the papers. Of course the entire reconstruction picture is more complex. Let's stay focused. What do you have to say about these elements as criteria for data selection?
Phil - to take the specific case you provided, what about Hartwell's work uses the experimental data being measured to select the data sets to be used?
What I see is the use of temperature sensitivity to select subjects, but in that context the temp sensitivity is metadata about the subject. They were working on genetic issues, not temperature issues. I don't see where it is part of the actual data analysis, which involves searching for of the genetic attributes.
Compare with these climate studies, where the same data is being used for both selection and analysis.
A detailed response to WMC's response to my Five Claims in Comment One will follow shortly. Due to its length, it may get caught in Stoat's spam filter. Here is the summary version.
WMC does not explicitly and unconditionally agree with any of the five claims. Neither does he offer any data or arguments that would weaken any of them.
Claim 1 -- Requested documentation supplied.
Claim 2 -- Requested documentation supplied.
Claim 3 -- Requested documentation supplied.
Claim 4 -- On reading Tiljander et al (2003) (linked in Comment 2), Claim 4 is revised to read,
(4.) That the varve proxy was calibrated by Mann et al over a period (1850-1995) in which higher regional or worldwide temperatures were correlated to higher X-Ray Densiy (xraydenseave), to higher mineral matter (lightsum), and to greater thickness (thicknessmm). These correlations are upside-down with respect to those assigned by Tiljander. Mann et al assigned a correlation of higher regional temperatures to higher organic matter (darksum), which is consistent with Tiljander's interpretation. In any case, Tiljander's Figure 2 strongly suggests that the instrumental temperature record at stations near Lake Korttajarvi show little or no upward or downward trend, 1881-1993.
Claim 5 -- WMC's response is largely opaque to me.
AMac's Conclusion: The Lake Korttajarvi varve proxy series were incorrectly used in Mann et al (2008). Three of the four were used upside-down with respect to the original authors' understanding of their meaning. None of the four show a strong and clear-cut correlation to local temperatures 1881-1993, a complication unmentioned in Mann et al's text or SI.
WMC --
You presented your views on the five claims as bracketed text inserted in Comment 1, at some point this weekend (I think). Thanks; I hadn't noticed them till just now.
(1.) That Tiljander believes that the climate signal in the Lake Korttajarvi varve dataset is that higher local temperatures correlate to thinner, more-organic-rich, lower-XRD varves.
AMac responds: Tiljander et al (2003) (ref. 12 of Mann et al SI) is linked in Comment 2. On the "sign" of the {organic/mineral :: temperature} correlation, Tiljander writes on page 571, "Periods rich in organic matter indicate favourable climate conditions, when less snow accumulates in winter by diminished precipitation and/or increased thawing, causing weaker spring flow and formation of a thin mineral layer. In addition, a long growing season thickens the organic matter. More severe climate conditions occur with higher winter precipitation, a longer cold period and rapid melting at spring, shown as thicker mineral matter within a varve. ... short-term changes (averaged over a few years) could be estimated."
page 573: "An organic rich period from AD 980 to 1250 in the Lake Korttajarvi record is chronologically comparable with the well-known âMedieval Warm Periodâ ... The relative lack of mineral matter accumulation and high proportion of organic material between AD 950 and 1200 was also noticed in two varved lakes in eastern Finland (ref) as well as in varves of Lake Nautajarvi in central Finland c. AD 1000â1200 (ref). Common to all sites is that the warm period lasted more than 150 years."
page 574: "According to the Lake Korttajarvi varve record there is a short period, AD 1115â1145, with increased mineral matter accumulation, indicating more severe winters. In the Fennoscandian tree-ring record (Briffa et al. 1990), the largest 50-year cooling trend in the 1400-year long record (-1.78°C) occurred between AD 1090 and 1139 and the coldest 20-year mean occurred between AD 1127 and 1146."
But note (page 574): "Even though the sedimentation in Lake Korttajarvi most likely reflects relatively long-term changes in local hydrology rather than temperature, ..."
"[Tiljander] didn't do the calibration" is true but irrelevant to Claim 1. Page 572, "In the case of Lake Korttajarvi it is a demanding task to calibrate the physical varve data we have collected against meteorological data, because human impacts have distorted the natural signal to varying extents during the past 280 years and the meteorological data in the Juvaskyla area are only available since 1881."
(2.) That Tiljander cautioned that after ~1720, the Lake Korttajarvi varve dataset is likely affected by local-human-activity signals, leading to thicker, more-mineral-rich, higher-XRD varves than climate alone would produce.
AMac responds: In the Summary, Tiljander wrote (page 575): "In the Lake Korttajarvi sediment sequence, the effect of human impact has increased since the mid-18th century and has obscured the signal of natural climate variability."
Supporting quotes from earlier in the paper follow. Page 571, "The thinnest varves accumulated from AD 900â1800 (average 0.68 mm), and during the last 200 years the average varve thickness has been 1.60 mm. This recent increase in thickness is due to the clay-rich varves caused by intensive cultivation in the late 20th century." Also quote from page 572 under Claim 1.
[So I'd read that as No, Tiljander don't say so. The "obscured" text is not as clear as it could be. I think the subsequent discussion has shown that its not a good proxy from 1800, or whenever, as I've said several times already. It would have been better if the original paper had said, "don't use this as a proxy from X on" -W}
(3.) That Tiljander has described two incidents of local activity that led to very thick, mineral-rich, high-XRD varves, in 1930 (peat ditching) and 1967 (bridge reconstruction).
AMac responds: Tiljander page 575: "There are two exceptionally thick clay-silt layers caused by man. The thick layer of AD 1930 resulted from peat ditching and forest clearance (information from a local farmer in 1999) and the thick layer of AD 1967 originated due to the rebuilding of the bridge in the vicinity of the lakeâs southern corner (information from the Finnish Road Administration)."
(4.) That the varve proxy was calibrated by Mann et al over a period (1850-1995) in which higher local temperatures were correlated to thicker, more-mineral-rich, higher-XRD varves.
AMac responds: Being inspired by Rattus Norvegicus' careful answers, I've (obviously) reviewed Tlijander et al (2003); this causes me to revise Claim 4, as follows:
(4.) That the varve proxy was calibrated by Mann et al over a period (1850-1995) in which higher regional or worldwide temperatures were correlated to higher X-Ray Densiy (xraydenseave), to higher mineral matter (lightsum), and to greater thickness (thicknessmm). These correlations are upside-down with respect to those assigned by Tiljander. Mann et al assigned a correlation of higher regional temperatures to higher organic matter (darksum), which is consistent with Tiljander's interpretation. In any case, Tiljander's Figure 2 strongly suggests that the instrumental temperature record at stations near Lake Korttajarvi show little or no upward or downward trend, 1881-1993.
Statistics are not needed to address this point. Most readers possess at least one functional Mark I Eyeball. Application of this tool to the four Tiljander proxy traces in Figure S9 and to Tiljander Figures 2 and 9 (lightsum and darksum) will suffice.
[These correlations are upside-down with respect to those assigned by Tiljander - well no. Those correlations are in the data, Tiljander can't assign them any other way. Do you mean, that the sign of correlation of the proxy varies before / after 1800? If you do, I assume you have only indirect evidence for that, instrumental evidence being lacking -W]
(5.) That Mann et al used the Lake Korttajarvi varve proxy in the reconstruction of the Temperature Anomaly record by applying the 1850-1995 correlations (thicker, more-mineral-rich, higher-XRD varves with higher temperatures) to the varve record spanning 200 AD to 1850 AD.
AMac responds: The meaning of WMC's remarks on Claim 5 are opaque to me. They don't seem to call for any further documentation. However, I add (per Claim 4 above) that although Mann et al assigned reversed-sign orientation to the {varve :: temperature} correlation for three varve characteristics, their algorithm picked the rightside-up orientation for darksum (organic matter).
[I'm not sure how claims can be both opaque and require no further documentation. But I'll leave you to ponder until you do understand -W]
The implications of the Five Claims on the interpretation of Figure S8 I leave for another day, except to say that this figure now appears trivial at best and misleading to the reader at worst. ("Misleading" if Mann et al meant to use it to show the robustness of their proxy selection process, or of the results of that process.)
[S8 is neither trivial nor misleading. It shows the effects of removing the Tiljander proxies (and some others) are slight; which is what I'd expect from looking at S9 -W]
- - - - - - - - - -
AMac's Conclusion: The Lake Korttajarvi varve proxy series were incorrectly used in Mann et al (2008). Three of the four were used upside-down with respect to the original authors' understanding of their meaning. None of the four show a strong and clear-cut correlation to local temperatures 1881-1993, a complication unmentioned in Mann et al's text or SI.
[I'm baffled how you can reach that conclusion. I don't know what you mean by "incorrectly used" - if you mean, algorithmically, then you're wrong. If you mean, they were incorrect to have used those proxies at all, then you may be correct (but S8 says that doesn't matter much to the overall answer). Given the endless cycles of misunderstanding your "used upside down" is at best unclear -W]
re: #81, Phil.
"There are many examples in the study of turbulent flows for example, . . ."
Will you kindly supply a cite or two; maybe a review article or textbook?
Thanks
Here is Tiljander's paper, so you can verify any quotes yourself.
http://www.climateaudit.org/pdf/others/Tiljanderetal.pdf
MrPete, I think you are confusing two things. One is selecting data based on their correlation with the recent temperature record (the d'Arrigo case). I agree that this is problematic.
[If it is a good temperature proxy, it will correlate to the recent temperature. If it doesn't correlate, it isn't a good proxy. Remember that *none* of these series are as good as a thermometer. However the converse - if it does correlate, it should be a good proxy - isn't true in theory and seems to have been demonstrated as untrue in the Tiljander case -W]
However, it is general statistical principle that you can use your data to select which data you use, as long as (and this is the important part) your selection criteria are independent of the effect you are looking for (i.e. do not bias it in one way or another). I haven't read the papers, but from your references both the Tingley & Huyber and the Briffa paper pass this test. For instance, low power at time intervals of less than 50 years should not bias your data towards either the MCA nor the current anomaly, and is therefore complete unproblematic.
[Cuts -W]
"These correlations are upside-down," continued
WMC remarked: [These correlations are upside-down with respect to those assigned by Tiljander - well no. Those correlations are in the data, Tiljander can't assign them any other way. Do you mean, that the sign of correlation of the proxy varies before / after 1800? If you do, I assume you have only indirect evidence for that, instrumental evidence being lacking -W]
I'll consider darksum, one of the three Upside-Downs. Tiljander states that varves with higher mineral content have higher darksum values (Fig. 9). For the Holocene prior to ~1720: "More severe climate conditions occur with higher winter precipitation, a longer cold period and rapid melting at spring, shown as thicker mineral matter within a varve" (pg. 571).
{Cooler local temperature :: higher darksum}, Tiljander says.
However, local human activities after ~1720 dominate the varve record, mainly by increasing mineral content. Tiljander did not observe a {climate :: darksum} correlation in the varves deposited between 1720 and 1997.
Mann et al "tried to limit [their selection of non-tree-ring proxies] to records that were reasonably well dated and where the original analysts had shown that there was a paleoclimatic signal associated with the proxy" (SI pg. 1). And yet, Figure S9 shows that they were misled by the rise in darksum during the calibration period 1850-1995. While the actual causality was
{More local human activity :: higher darksum}
Mann et al mistakenly found a spurious correlation between darksum and regional temperature:
{Warmer temperature :: higher darksum}, Mann et al say.
Whoops.
[You seem to be confusing local and regional temperatures. And you haven't answered my question, which is odd, in one so fond of asking them. If you did answer my question I think you'd find all your newly added text redundant -W]
But it's worse. For 1881-1993, temperature in the Lake Korttajarvi area held relatively constant (Tiljander Fig. 2). Thus, establishing a correlation between local temperature and darksum is not possible over this period of time.
Whoops.
[See above, and previous -W]
Readers who doubt what I'm recounting should follow Rattus Norvegicus' lead and look at Tiljander's paper for themselves. The PDF is linked in Comment #2. The picture is pretty clear.
WC, yes, a good proxy will have good correlation. But as your note infers ("the converse...isn't true in theory"), we can't pick proxies that way; it's meaningless. Otherwise all kinds of meaningless data series could be selected as proxies.
We need to have a physical reason -- in essence, a set of metadata criteria -- to select proxies. And then, all proxies that fit the criteria must be taken. Otherwise, we're simply fooling ourselves.
Paz -
Got to go deeper on "as long as selection criteria are independent of the effect."
Metadata isn't simply independence due to lack of "data effect" bias. Metadata criteria can not be a function of any attribute of the analysis itself (values, the three CI's, etc.)
Otherwise, what we're doing is essentially data/uncertainty/model snooping, creating a self-validating hypothesis.
Thought experiment: rather than collecting data from the past, imagine that we're defining the experiment for future data. There should be no difference in the selection criteria.
Bottom line: to be valid, the selection criteria must not peek, even indirectly, at any aspect of the analysis output. Which means it can't peek at any of the variables that form part of the analysis.
Blunt Example:
Data set A: 3 2 2 2 2 6 6 6 6 5
Data set B: 3 3 3 3 3 5 5 5 5 5
Data set C: 3 0 8 7 1 2 6 5 3 5
Data set D: 3 5 5 5 5 3 3 3 3 5
Stated goal: avg value of data matches avg of calibration dataset (4.0)
I can choose all kinds of data-based criteria for these data sets that will select the ones I prefer, without touching the "desired effect." Yet I will greatly impact various characteristics of my analysis by doing so.
I don't have time to go deep in to this and it don't make much seems to me to do so... What is all the fuss about?
Some thing that is interesting though is how good the proxy correlates with the measured temperature shifts... Is it probable that human activity has had such a high correlation with shifts in temperature? Maybe... well still I am as unconvinced about that as to whether it is wrong to use the proxy or not... Still I confess I have not put to much time in to this.
Here's a humorous example based on my current favorite illustration of the three kinds of uncertainty (data, model, parameter):
Hypothesis: next-older siblings are twice as old as younger siblings.
Data selection criteria:
* Choose nearest-age sibling pairs
* Prefer larger families (for ease of collecting large samples)
* Select when younger siblings are at 2 years (old enough to have settled in to the "pattern", young enough to be "growing strong"
NONE of those criteria "bias" the relative age of siblings. The only problem is they might have a relationship to relative age, but so what? They don't bias it.
I hope it's obvious, both how this illustrates challenges in data selection criteria, as well as uncertainty in models and parameters.
:-D
The main concern here is error bars. If one mines for the signal as most of these proxy methods do, it is very difficult to make any kind of decent estimate of the error bars without further side information justifying the "thermometer" nature of the proxies. Therefore, the fact that MEA's algorithm turns a temperature proxy upside-down is a warning that the error bars are quite likely underestimated.
Reading "Mea Reply to McI", they justify their error estimates as follows:
The method of uncertainty estimation (use of calibration/validation residuals) is conventional (3, 4)
Where (3,4) are:
3. Luterbacher J, Dietrich D, Xoplaki E, Grosjean M, Wanner H (2004) European seasonal and annual temperature variability, trends, and extremes since 1500. Science 303:1499â1503.
4. Wahl ER, Ammann CM (2007) Robustness of the Mann, Bradley, Hughes reconstruction of surface temperatures: Examination of criticisms based on the nature and processing of proxy climate evidence. Clim Change 85:33â69.
All the authors bar one are not statisticians. Dietrich is the exception. But there is no detailed description of uncertainty estimation in 3.
The problems that can arise with error estimates when you are actively selecting from the data are obvious, but for some mathematical discussion I suggest this paper: Algorithmic stability and sanity-check bounds for leave-one-out cross-validation
MikeN: LoL! Mann obviously can't have read Tiljander's paper, or he wouldn't have used it as key proxy in his HS!
[Why is it a "key" proxy? -W]
WMC - you should probably try reading it yourself - it's a goody!
[I've skimmed it. What makes it particularly interesting, would you say? -W]
WMC - I find the discussion about the Medieval Warm Period "AD 850â1500: The Middle Ages" particularly interesting...
- not only the information about it's size (temperature) and length, but also the rapidity with which the climate changed during that period is also interesting (to me anyway)
[Ah. I didn't see anything new there, that isn't in http://en.wikipedia.org/wiki/Medieval_Warm_Period for example -W]
WMC - Sorry - I didn't realise that it was generally accepted that the MWP was 0.8C - 1.0C warmer than today.
[Tiljander doesn't calibrate to temperature, and is only one point. So I'm puzzled as to how you're pulling a temperature out of it, let alone a hemispheric one -W]
- and that rapid climate changes are not unusual.
[D-O? -W]
Perhaps I've misunderstood what all the AGW fuss is about?
[Seems entirely likely -W]
WMC â-
Your removal of the first half of my last comment (11/1 9:35 PM) makes it difficult for readers to understand me. I hope you will reconsider that editing decision, and reinstate what I wrote.
Inline in the rump comment, you say,
[You seem to be confusing local and regional temperatures. And you haven't answered my question, which is odd, in one so fond of asking them. If you did answer my question I think you'd find all your newly added text redundant -W]
My use of the term local temperature refers to the instrumental temperature record at Lake Korttajarvi as presented by Tiljander for 1881-1993 in Fig 2. My use of the term regional temperature refers to the temperatures that Mann et al calculated via RegEM for the relevant grid box (Northern Europe?) for their calibration period, 1850-1995 (SI pg. 2).
Re: "And you haven't answered my question" -- There are three questions in your inline remarks in my 10:42 AM comment. Here they are, with brief answers. Indicate which one you meant, and I'd be glad to expand.
WMC: Do you think that Tiljander says anywhere that the proxy is useless for temperature after 1720? After 1800?
AMac: Yes.
WMC: Do you mean, that the correlation (Tilj, Temp) for the period 1850-1995 is of such a sign that it implies that higher temp is associated with thicker varves?
AMac: In my opinion, there is no relevant (Tilj, Temp) correlation for the period 1850-1995.
WMC: Do you mean, that the sign of correlation of the proxy varies before / after 1800?
AMac: I can't meaningfully answer the question as posed, because a clear climate signal is lacking in the post-1720 varve record.
The temperature numbers I mentioned come from the Tiljander paper in the section labelled "AD 850â1500: The Middle Ages"
Here is a quote:
"
Evidence of warming on the
Kola Peninsula (c. AD 1000â1300) is provided by treeline
studies, which show that pine grew at least 100â
140 m above the modern limit during the Medieval
period, which corresponds to a (summer or annual
average) temperature at least 0.8°C higher than today
(Hiller et al. 2001). A pollen reconstruction from
northern Finland suggests that the July mean temperature
was c. 0.8°C warmer than today during the
Medieval Climate Anomaly (Seppa¨ 2001). A study
based on oak barrels, which were used to pay taxes in
AD 1250â1300, indicates that oak forests grew 150 km
north of their present distribution in SW Finland and
this latitudinal extension implies a summer temperature
1â2°C higher than today (Hulde´n 2001).
"
- true, it's regional, not hemispheric
[You need to be somewhat careful about what they mean by "today"; sometimes that means mid-20th-C -W]
Also:
"
The existence of the Medieval Climate Anomaly is
widely accepted, although Bradley (2000) doubts that it
was as warm as the last few decades of the 20th century.
Also some records indicate that the Medieval temperatures
were less than or comparable to the mid-20th
century warm period (Growley 2000). A Greenland
borehole record, however, implies that the Medieval
period was 1°C warmer than today (Dahl-Jensen et al.
1998).
"
[Sure, there are piles of these things. Pretending that you can pick any one and *know* the MWP was warmer than to day is wrong. But this is just the hockey stick wars all over again, and I have no interest in re-fighting that -W]
Also, this bit is interesting, and pertinent to the main topic of this thread:
"
We were able to distinguish two known climate
periods, the cold event at around 900 BC and the
Medieval Climate Anomaly at AD 980â1250. There are
also minor evidences of the climate fluctuations during
the Little Ice Age: two periods AD 1580â1630 and AD
1650â1710 indicate a slightly wetter and colder climate
than today. In the Lake Korttaja¨rvi sediment sequence,
the effect of human impact has increased since the mid-
18th century and has obscured the signal of natural
climate variability
"
But I'm not sure why I have to quote long passages of Tiljander, rather than just refer you to the orignal text
[Your point, I think, is that they can't find a LIA: The Little Ice Age, however, was not clear in our record, although there were two minor cooling periods in AD 1580â1630 and AD 1650â1710 from the abstract. As to your other quote: this speaks rather directly to something I've seen elsewhere: people interpret the wiggles in their records in terms of what they know is supposed to be there. Tiljander goes through contortions to try to see a LIA rather than stating clearly in the conclusions that it isn't there -W]
You seem to be ducking the point that Mann used the proxy upside-down, by saying that anything after 1800 is invalid. However, Mann did use the data after 1800, and you appear to be conceding that this was an error.
So in your opinion was his use of the data in the right direction, or was it upside-down?
[So many people seem incaplable of seeing the bleedin' obvious here, its going to need a new post. I've already said it but you're having a hard time reading it because it isn't what you want to hear -W]
WMC --
In my comment of 11/2/09 @ 10:58 AM, I distinguished "local," instrumentally-measured temperature at Lake Korttajarvi from the "regional" metric derived by Mann et al. Does that seem like a useful distinction to you?
I also addressed three questions you had raised; was one of them the query that you thought I was ducking? Do you agree with my answers?
[I didn't *think* you were ducking anything. I was pointing out that you'd failed to answer.
You know what my answers are, because I've said them already. If you can't read them, you'll need to try a bit harder -W]
Say, when and where was SM's bristlecone paper last seen? I found a reference over at Tamino's from 2007:
" tristram shandy // October 27, 2007 at 2:16 pm
the cores are being analyzed by an independent lab. The name of the lab is on CA, go RTFM. The data will be archived and made public....."
Nothing since that I know of, but I'm sure someone here is more up to date on this.
Some time ago I took a peek at this issue, looking at this McIntyre's post:
http://www.climateaudit.org/?p=3967
Just by looking at the figures in that post, one can see that the data is not upside down there. McIntyre's Fig. 1 presents in left panel part of Tiljander et al. (2003) Figure 5 (but not showing the "X-axis" values which are available at the original figure from Tiljander et al.), and in the right panel is McIntyre's inverted version.
http://www.climateaudit.org/pdf/others/Tiljanderetal.pdf
Figure 2 in McIntyre's post presents, according to McIntyre, "two of 4 versions used in Mann et al 2008". Left panel presents the same data as the two in Fig. 1. Compare the values in McIntyre's inverted version and Mann version in Fig. 2. See for example the spike at about year 1100; the value of that spike in McIntyre's inverted graph is almost 140, and the value of Mann's version of that same spike is almost 140. Same value? What about the spike near year 2000? Value for that in McIntyre's version is over 160 and in Mann's version it is over 160. Continue comparing, you will see that all datapoints in these figures give the same values for the year and relative X-ray density. Compare the values also to Tiljander et al. figure, Mann's version is the same as Tiljander's version. You can also check the Mann et al. (2008) SI figure S9 and see that the same values are found there too. Mann et al. (2008) data doesn't seem to be upside-down compared to Tiljander et al. (2003), or compared to McIntyre's own presentation.
If someone wants to look at the right panel of Fig. 2. That is Tiljander et al. Figure 9, and Mann's version seems to be quite similar to Tiljander et al. version, at least certainly not upside-down.
So, is this whole thing about McIntyre wanting to present relative X-ray densities so that values during MWP show up higher in the graph than values during the LIA?
See also Mann et al. SI figure S10. There individual proxies are presented on top of each other. If Tiljander et al. data would be upside-down, they would stand out in that figure very clearly.
Ari Jokimäki-
The problem isn't that the X-axis is 'upside-down', the problem is that the data has been used in Mea in the opposite 'direction' to the way the physical-meaning of the data implies it should be used
- e.g. less dense varve = higher temp
You should read Tiljander - it's quite a good read, and explains it quite clearly.
The fundamental problem is that human activity in the last 2 centuries has corrupted the data
- this causes a large spike in the opposite direction to what would normally be expected.
The author herself explains this in the last sentence of the penultimate paragraph:
"
In the Lake KorttajaĻrvi sediment sequence,
the effect of human impact has increased since the mid-
18th century and has obscured the signal of natural
climate variability.
"
So the real problem is not which way up the data is, but the fact that climate variability signal has been obscured
As WMC explains in a reply above:
[If the proxy is unreltaed to temperature over the last 200 years then it is unusable for Mea's method -W]
I would go one step further, and say:
*Since* the proxy *is* unrelated to temperature over the last 200 years, it is unusable for Mea's method
This, of course, is what Mann shows in figure S8
- but I would argue that this data should have been discarded much earlier in the process, as it only serves to confuse the issues.
Ari (101),
Yes, the graphs all look the same, but you need to read the accompanying text to understand the differences in interpretation. The Tiljander et al interpretation is that the X-ray density varies inversely with temperature. That is, higher X-ray densities corresponded with colder climatic periods. Mann et al looks at the same varve proxy over the period 1850 - 1995 but argues a positive correlation between X-ray density and temperature. So the argument is not about the orientation of the graph in relation to X-ray densities. Rather it is the differences in interpretation by Tiljander and Mann.
SMc argues that both Tiljander and Mann cannot be right and because Tiljander describes the varve as being "strongly affected by human activities" during the 20th century, SMc chooses to side with Tiljander. So, the crux of the argument does not depend on statements made by SMc. It depends on the science of Tiljander's and Mann's separate interpretations and whether the community can live with the supposed contradiction.
So far, I see three camps. The first is the one where SMc resides. The 2nd sees no need to question either paper and is happy to live with that outcome. And the 3rd chooses to not argue the science and just claim it doesn't matter.
Phil M. (#102):
"The problem isn't that the X-axis is 'upside-down', the problem is that the data has been used in Mea in the opposite 'direction' to the way the physical-meaning of the data implies it should be used"
No. See Mann et al. (2008) SI figure S10. That shows in which direction Mann et al. have used the Tiljander et al. (2003) data. The Y-axis of figure S10 is temperature anomaly, and as you can see, Mann et al. have the Tiljander data there so that MWP shows up warmer than LIA.
McIntyre claimed in the post to which I gave a link above: "By flipping the data opposite to the interpretation of Tiljander et al, Mann shows the Little Ice Age in Finland as being warmer than the MWP, 100% opposite to the interpretation of the authors and the paleoclimate evidence."
Simple peek to Mann et al. figure S10 shows this claim to be false. Note also that McIntyre talks about flipping the data opposite. I showed above that there has been no data flipping.
Oh, and by the way, their official claim was: "Their non-dendro network uses some data with the axes upside down,..."
From here:
http://www.pnas.org/content/106/6/E10.full?ijkey=6054afc9aeb848de052d62…
Ari
Figure S9 shows the use of the Tiljander data
- and shows that the Tiljander data is used with the opposite interpretation to the author's and the paleoclimate evidence.
- in particularl, if you study S9 in conjunction with the Tiljander paper, and with reference to concerns that the author had with the data after the mid 18th century.
- Figure S10 doesn't looks very clear to me, as there are so many plots on top of each other
- but it looks to me that when the Tiljander data is withheld, the WMP gets slightly warm, and the LIA gets slightly colder
- which is also what is shown in figure S8
- so I think these plots are in agreement with McIntyre, in terms of the direction of the data
- but the effect does not appear to be very great
- but whether or not the effect is large, I think, given that there seems little doubt about the data being unsuable after the 18thC, I think Mann should have excluded this data from the outset
- perhaps the bad 18C+ data could have been suppressed, and the good data portion used, using a splicing technique, but this would also have problems, I suspect.
In the SI, I think one or two more plots would be useful
- we have S7 'Full-Screened' vs 'Non-dendro Screened'
- and we have S8 'Full-Screened' vs 'Full-Screened minus 7'
- it would be interesting to see 'Full-Screened' vs 'Non-dendro Screened Minus 7'
- to see what effect the '7' have on the plots in the absense of dendro data
Also of interest would be 'Full-Screened' vs 'Full-Unscreened'
- see what effect the screening process has on the results.
Rather than figure S10, which I think is unclear, I think it would be useful to also see a graph similar to S9, but with the data scaled to their final weightings (a sort of expanded S10)
Phil M. (#105):
"Figure S9 shows the use of the Tiljander data
- and shows that the Tiljander data is used with the opposite interpretation to the author's and the paleoclimate evidence."
I already addressed Mann et al. (2008) SI figure S9. But let us look at it again more closely. There's a dataset called "tiljander-2003-xraydenseave". That corresponds to Tiljander et al. (2003) figure 5, leftmost panel. The S9 shows a spike at about year 1100 having a value of less than 150. Similar spike is found from Tiljander Fig. 5. Both figures have similar spikes nearer year 2000, so this data is clearly shown in same manner as in Tiljander et al.
Then in S9 there's "tiljander-2003-lightsum" which corresponds to Tiljander Fig. 9, upper panel. S9 Y-axis values have been given differently than in Tiljander, and it seems to be so that S9 values are 10000 times of those in Tiljander Fig. 9. Other than that, the figures seem to be correctly, not opposite of each other.
Next is "tiljander-2003-thicknesssum" which is Tiljander Fig. 5, second panel from left, I think. Doesn't seem to be oppositely interpreted in Mann et al. Same thing with "tiljander-2003-darksum" (similar Y-axis thing here than in "lightsum") which corresponds to Tiljander Fig. 9, lower panel. That's it, we've run out of Tiljander datasets. I don't see any evidence of them being oppositely interpreted.
Phil M. also said: "Figure S10 doesn't looks very clear to me, as there are so many plots on top of each other"
That's the point. If Tiljander et al. data would have been interpreted so that LIA would be warmer than MWP, which is McIntyre's claim, Tiljander data would stand out in S10, either at MWP or at LIA or most likely at both. If the data would have been used in opposite sense in Mann et al., it would mean that Tiljander data would show exactly the opposite behaviour to rest of the proxies, or otherwise it would stand out in S10. Perhaps you can explain how it is possible to Tiljander data to be inverted and still trace the same paths as other proxies in S10? Is it really so that in Finland (where I live) temperatures have been developing exactly the opposite than in rest of the northern hemisphere, and have been doing so for over 1000 years?
Thanks Ari,
That's a very simple and apt way to look at the reversal claims for the Tiljander datasets. The Mann et al. figures look that way to me too.
Ari Jokimäki 11/6/09 2:52am --
I agree with your rundown of the four Lake Korttajarvi proxies, in that "higher grey value" or "greater thickness" are "towards the right of the page" in Tiljander Fig. 5, or "towards the top of the page" in Tiljander Fig. 9. Mann faithfully shows these as "towards the top of the page" in Fig. S9.
Tiljander's interpretation was that harsher climate could cause greater mineral content, prior to 1720. She thus interpreted higher values for X-ray density and LS as indicative of lower temperature.
Tiljander suggested that milder climate could cause greater organic content, prior to 1720. She thus interpreted higher values for DS as indicative of higher temperature.
I don't recall an explicit interpretation in her text for varve thickness.
It appears from Mann's description of the procedure of calibrating to 1850-1995 regional temperature, that all four Tiljander proxies were used such that (warmer temperature) is positively correlated to (higher grey value) for xraydenseave, lightsum, and darksum. For thicknessmm, (warmer temperature) seems to be positively correlated to (thicker varve).
Per the discussion by WMC in the "Tiljander, again" post, xraydenseave and lightsum appear to be examples of an "inverted A" type proxy (warmer temperature causes lower value; post-1850, climate input overwhelmed by higher signal due to local human activities).
AMac (#109):
"It appears from Mann's description of the procedure of calibrating to 1850-1995 regional temperature, that all four Tiljander proxies were used such that (warmer temperature) is positively correlated to (higher grey value) for xraydenseave, lightsum, and darksum. For thicknessmm, (warmer temperature) seems to be positively correlated to (thicker varve)."
Mann et al. (2008) figure S10 would show it if any of the Tiljander series were wrong way around. If for example X-ray density or lightsum would have been interpreted wrong way in Mann et al., it would show up in fig. S10 (which shows the temperature anomaly, so it shows how they have interpreted the presented dataseries) so that they would trace different path than other dataseries.
I don't know if there's some textual mistake or awkwardly worded text about this, but in my opinion the SI figures explicitly show that there's no data upside down or even interpreted upside down.
Ari Jokimaki, thanks for your 11/6/09 3:52pm response.
Please refer to my 11/6/09 3:52pm comment (#26) in the Tiljander, again thread.
At his Penn State U. website, Mann corrected Fig. S8a some time ago. (The site no longer archives that version, or gives its date of upload.) On 11/4/09, he replaced the corrected version with one adding two more traces. I'm not sure if the 11/4/09 version contains further changes to the traces shown in prior versions.
You offer an interpretation of Fig. S10 as it appears in the SI. It seems to me that Figs. S8a and S10 should share the same basic "NH CPS Land Temperature Anomaly Reconstruction" trace, as calculated from all proxies. For example, observe the three peaks rising over the dotted line at ~1040, ~1090, and ~1180. This pattern is different in the corrected S8a.
Further down in the "Tiljander, again" thread, Rattus Norvegicus, Hank Roberts, dhogaza, and I engage in discussions that are relevant to your broader analysis (they generally agree with your perspective; I don't).
I fail to see this as evidence of upside-down datasets. I'm also not so sure if S10 "all" is comparable to S8. S10 "all" might just be formed only out of those proxies that are presented individually in S10 (only 15 of them is presented there). And at any case, that is not what McIntyre is arguing, which was what I was commenting on.
I must make a correction here; I had misunderstood the figure S10 so that it would show each proxy's temperature anomaly, but it shows how the end result changes when each proxy are taken out from the analysis. So, everything I say above about S10 is false. My sayings about S9 are still valid, however, proxies are not upside-down there.
Sorry about the confusion.
I'd be commenting over two years after the conversation above, but here goes...
Observations (and I haven't read the research papers yet):
1) It seems Mann may have used an algorithm that tests correlation and anti-correlation of any given time series against at least the last 2 centuries of temperatures. Perhaps as well, the algorithm then uses those proxies that passed the test to construct a proxy record. The reconstruction uses each accepted time series in a weighted fashion where the (positive or negative) weight is a constant applied to the whole time series. The algorithm's implication is that the entire time series being tested and then used in reconstruction cannot be encoded throughout or that encoding will be what shows up in the reconstruction.
2) The Tiljander series that passed the test with correlation in a positive sense were "encoded" throughout (relative to the endings) because effectively they each had at least one twist in the data, where the latter portion used in the testing phase would correlate positively with rising temperatures of the last two centuries, but where the earlier part of the series was deemed by the series' author to always anti-correlate (plus or minus unknown noise).
3) Even assuming Mann leveraged incorrectly one or more of the Tiljander series because of the issues just raised, Mann ended up providing alternative reconstructions that remove these and a few other suspect series. Regardless of whether included or not, such series contributed negligibly to the end result, so the likely impact of possible errors in the handling of the Tiljander series would have been minimal to the conclusions [and Mann stated this much].
4) Points have been brought up at least through a linked McIntyre rebuttal that Mann's algorithms applied to red noise time series leads to "hockey stick" reconstructions. To what extent Mann's method works on mostly legit data and to what extent his proxies constitute legitimate data may or may not have been analyzed. It's of concern, naturally, how any such flaw in Mann's methodology (as applied to a specific time series or in general) may have affected his results and conclusions and those of other researchers further building upon that research.
I do want to emphasize that the red noise issue is a real concern (whether or not Mann's result is affected by it to a significant degree). If you have a very large set of random garbage time series and pick out those that have a rising ending (to pick a specific example of a test), you will end up with lots of series that are otherwise random but all share a particular rise at the end. If you then do an ordinary weighted sum of these series, in general, you should expect a mostly flat series (since assumed Gaussian random errors tend to "cancel out") except at the end, which will be rising since all weighted contributing series, by definition as per their selection criteria, included such an ending rise. Care has to be taken to avoid such scenarios as much as possible (ie, of bogus proxies passing the test), and this flattening tendency should be modeled and analyzed to see what error is being introduced into any particular reconstructions. Without analysis addressing this red noise concern, we should probably assume the hockey stick effect is an artifact of the methodology and the conclusions of Mann's paper do not follow from that particular study.
[The red-noise issue is a real one, but it turns out that McI's results on that issue were either wrong or dishonest - it isn't clear which. McI artificially mined his results to find those best suited to see what he wanted to see. You should note that you're proposing some very basic tests - please don't fall into the "these scientists are stupid" trap by imagining that people haven't already thought of the obvious -W]