
Right, the previous thread has spilled off a discussion of Jastrow, Nierenberg and Seitz and their representation of a Hansen et al. figure. I have the feeling that the JNS paper may have appeared in multiple places, but the one I have access to is:
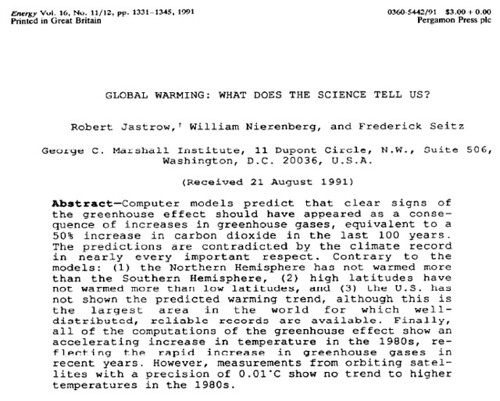
There is a lot wrong with that abstract (culminating in the once-traditional but now discarded over-reliance on the S+C satllite record) but the bit that is of immeadiate interest (because it figures in the previous discussion) is their take on figure 5 from Hansen et al. Which is:
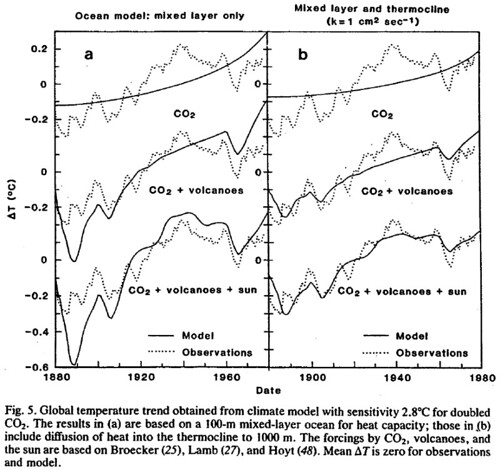
And which they "reproduce" as:
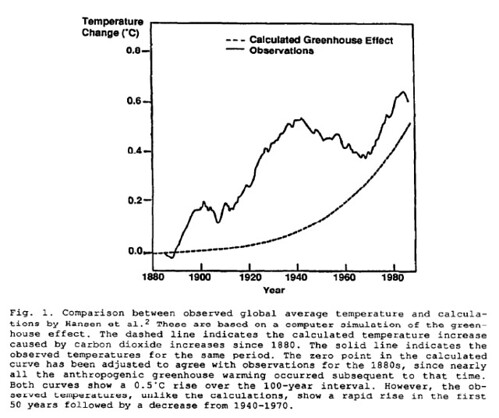
The "2" after "Hansen et al." is a ref to the 1981 Science paper, so we really are talking about the same thing. They don't say which figure, but it has to be fig. 5 (but see-also below the fold).
So, is their reproduction fair?
[Update, and post pulled to top (original publication date 2010/08/26) to show it: I've now discovered something vaguely interesting, in reading the "original" Nierenberg report, chapter 5 (which I never got to in my "book club" series). That is, their fig 5.8. Which is - ta da - the Hansen 1980 figure, panel (a) only: ie, just the CO2. But it is a faithful reproduction of the original - same obs, same start and end times, and the model line isn't shifted downwards. So my guess would be that JNS got their fig from the Nierenberg report, rather than going back to the original. That doesn't excuse them, of course. But it interesting that fig 5 of the Nierenberg report makes similar claims to JNS: it notes that the figure doesn't match the temperature record very well (der, of course it doesn't), and it fails to note, in that section, the other panels of the Hansen figure. So, who wrote chapter 5? Gunter Weller, James Baker, W Lawrence Gates, Michael MacCraken, Syukuro Manabe, Thomas Vonder Haar. I don't know all of them, but at the very least Manabe and MacCracken cannot possibly be called "skeptics". So how did that figure and discussion got into a chapter with their names on? Aha, because that section is about CO2 asa causal factor. They go on to reproduce the other panels of Hansen's figure, including the combination-of-all-factors panel. So chapter 5 is OK; but JNS isn't.
Also: I knew I'd seen and discussed this fig before: and the answer turns out to be Chez Eli - where else? But it was nearly 2 years ago.]
No, it isn't. Moving the zero line off the modelled response isn't really fair - their reasons are not good, and it would have been more honest to reproduce the graph that Hansen et al. originally drew. Asserting that you can just align the two curves in 1880 is unreasonable.
Also, the JNS figure isn't just a re-drawing of Hea, because the temperature record isn't the same - JNS use a temperature record that is somewhat longer (whether it differs in other detail I haven't checked). However, in this case I can't really fault them: mostly, because the longer record actually puts in more warming and makes Hea better. And partly because if you read their text it suddenly becomes clear that what they mean is "(the global temperature record) and (model from Hansen)" not "(the global temperature record and model) from Hansen". English really is a rubbish langauge.
But the main problem, of course, is the dishonest suppression of the rest of fig. 5 from Hea. JNS continue on to make much of the faact that the temperature observed doesn't look much like the modelled response, and totally fail to mention that Hea already know this, and that it is expected, and that model results with more forcings taken from the same figure do indeed show a good fit. Now you can, perhaps, argue over who exactly is being dishonest. If you want to forgive N, then you can say that maybe J got the figure drawn up and N never saw the original. I don't know. But unquestionable JNS considered as a joint author have been very dishonest here.
- Log in to post comments
While I think the "refurbished" graph is egregious, doesn't it actually go a long way towards admitting that - all other forcings aside - CO2 ends up having its way with the temps?
[Only if they believe that graph. But the context is "the model doesn't match the obs so the model is wrong" -W]
Someone looks like he might be beginning to get a glimpse of the forest. Promising.
http://www.marshall.org/article.php?id=770
IS MANMADE GLOBAL WARMING REAL AND DANGEROUS?
You are invited to a Capitol Hill Briefing for Senate and House Staff:
IS MANMADE GLOBAL WARMING REAL AND DANGEROUS?
A Look at the Key Issues and Evidence Underlying Cap & Trade Legislation
FRIDAY, OCTOBER 9, 2009
12 Noon to 2 p.m.
Room 116 Senate Dirksen Office Building
BOX LUNCH PROVIDED
Featuring:
* DR. FRED SINGER, Chairman, Nongovernmental International Panel on Climate Change; Prof. Emeritus Environmental Sciences, U.Va; first Director, Natl. Weather Satellite Service; former Director of the Center for Atmospheric & Space Physics, U.Md; author of numerous peer-reviewed articles; co-lead author of 700+page Climate Change Reconsidered(2009)
* DR. ROY SPENCER, Principal Research scientist, U. of Alabama, Huntsville; a U.S. Science Team Leader for NASA's Aqua satellite; former Senior Scientist for Climate Studies at NASA; author of numerous peer-reviewed articles; author of bestseller, Climate Confusion ('08)
* MARC MORANO, Managing Editor and Chief Correspondent of ClimateDepot.com newsletter; former Communications Director, Senate EPW Committee Minority Staff
SPONSORED BY: Science and Environmental Policy Project, Science and Public Policy Institute, The Heartland Institute, Oregon Institute for Science and Medicine, Committee For A Constructive Tomorrow, Center for the Study of Carbon Dioxide and Global Change, International Climate Science Coalition.
----------
I'm sure that WN would have strenuously objected to this sort of thing, right NN?
Surprise, moving baselines dates back well before Willis E thought about it. Eli supposes there is a moral about counting fingers here
Perhaps since JNS were physicists operating outside of their fields they felt free to play this sort of game? IOW JNS wouldn't be concerned about it harnming their reputations with other physicists?
Is this the first major use of S+C's misinformation? It's amazing that they were able to keep it up for 10+ years before others got around to checking their figures. As has been noted before, it's even more amazing that in the course of all the recalculating they did over the years they managed to keep consistently making the same error.
[FWIW, I don't think there is any credible evidence to think the cooling trend was in any way deliberate on S+C's part. And having been involved in complex codes, it is all to easy to repeatedly overlook a buried error. The only criticism I'd make would be that the trend probably quite suited them, and perhaps they didn't look as hard as they should for the error (for example, had the error caused a physically implausible trend 10* as large, they would certinaly looked for and found it) -W]
I presume S+C refers to Spencer and Christy, and the UAH (University of Alabama, Huntsville) atmospheric temperature reconstructions from satellite microwave data.
[Ha! You haven't read the < ahref="http://scienceblogs.com/stoat/2010/07/common_abbreviations_and_uncom.php">glossary! Ah, except S+C wasn't on that. Oops. Added. UAH was though -W]
It would be good to spend just a little bit more time making this blog more readable for people not quite so immersed in the subject matter. The information and perspectives here are worth it.
[Thank you -W]
Chris Ho-Stuart,
It's hard to make somebody change their habits. But I can profit from them.
For $5, I'll sell you a device that interprets WMC into standard English. For an extra $2, you can get the deluxe edition, which also handles Rabettese. It's more than just a translator - it also adds the context that's in their heads, but not put on the page.
[Sounds great. I'll take the $2 addtiion -W]
Not evil, just wrong?
But was the intent to inform or disinform?
Is it evil to knowingly and intentionally mislead people in the name of the larger good?
Probably not worth the effort to chase down that line of thought.
Regardless, this was intentionally wrong and misleading.
First of all I want to state that criticism of this figure, and the whole report is reasonable.
However as the text makes clear they are using the model data from Hansen Johnson Lacis and Lebedeff (1981 HJLL) and the temperature record from Hansen and Lebedeff (1987). They therefore aren't claiming to reproduce any particular chart from HJLL.
In this case I also don't understand the objection about the recentering. After all the fit at the end points looks pretty good. Moving the centering around wouldn't do anything about the 1940-1970 issue.
As to not including the volcanic and solar data, they probably should have discussed it. But I've done a little looking around and it appears to me that the volcanic data used by HJLL was pretty much out of favor within a couple of years of publication. There were two issues with the Lamb data. First it actually used temperature data so feeding it back into the model was somewhat circular. Second further analysis found that it was the amount of sulfur emissions that determined environmental effects. And in fact proxies for that were used in later climate models. Further they went on to discuss other factors including volcanoes, other aerosols, and solar.
Having said that this is clear a piece of what I would call science advocacy. They had a point of view and they were going to point to the evidence that backed that point of view.
Thingsbreak,
What's your point about the GMI conference? If WN was alive today he would be 91 (and I would be very happy). People are pretty much locked into their views at that age.
William, I agree that the initial error was probably unintentional, but as to characterizing what happened later I'm informed by their (mainly Christy's) subsequent record on other work. At some point a failure to look closely enough at their result because they like it so much becomes inexcusable. It's fine to be a scientific contrarian and focus on what you think are the weak spots in the science, but being so consistently wrong says that there's something more than just contrariness involved, and at that point it's a bill of goods, not science.
[I doubt I'll convince you, but having deeply buried bugs in code is commonplace and they can be very hard to find. I fully agree that subsequently it has become clear that S+C are on the sceptic side (though not rabidly so); I would, if anything, and in ignorance of their actual history, attribute this to the effect of being associated with, and defending, the record-that-showed-cooling. People get stuck with what they have -W]
I'll take a crack at the less interesting stuff.
"Contrary to the models, NH hasn't warmed more than the SH".
I suppose that signal hadn't clearly emerged in 1990. It has now.
http://data.giss.nasa.gov/gistemp/graphs/Fig.A3.lrg.gif
"High latitudes haven't warmed more than low latitudes"
Ditto.
http://data.giss.nasa.gov/gistemp/graphs/Fig.B.lrg.gif
but I guess high southern latitudes haven't seen as much warming. Then again, JNS starts with the false assumption that greenhouse gases are alleged to be the only driver of regional climate.
"U.S. hasn't shown the predicted warming trend"
I'm not sure what was "predicted" or if the authors know what the word means. We were only talking a decade since Hansen et al. 1981. Was something supposed to be "predicted" at that timescale on the regional level?
http://data.giss.nasa.gov/gistemp/graphs/Fig.D.lrg.gif
"measurements from orbiting satellites with a precision of 0.01 C show no trend to higher temperatures"
Not sure what the trend of the 1980's was in the satellite record, but that was pre diurnal drift (and other upward corrections). Current trend:
http://en.wikipedia.org/wiki/File:Satellite_Temperatures.png
One would think that with all these key skeptic concerns (some based on false presumptions) melting away 20 years later, a skeptic might adjust their thinking just a tad. As far as I know, Seitz was a hardcare contrarian through the end.
WC writes:
"The only criticism I'd make would be that the trend probably quite suited them, and perhaps they didn't look as hard as they should for the error"
I think that's a modest understatement. It wasn't just that they didn't go looking for errors. Spencer was pretty dismissive of criticism of his product, believed it was accurate to very high precision, and barely considered the notion that the data could be wrong. See his posed question "How do we know the satellite data are correct?"
http://science.nasa.gov/science-news/science-at-nasa/1997/essd06oct97_1/
It's interesting that JNS also stated the precision of the satellites was 0.01 C. What was that based on?
[That is an intersting find - credit I suppose to whoever hasn't tidied it and its cute spinning-earth gifs into the dustbin of history. Yes, very embarassing for S+C since (as you say) its claims on accuracy are hopelessly wrong. However The result is that the satellite temperature measurements are accurate to within three one-hundredths of a degree Centigrade (0.03 C) when compared to ground-launched balloons taking measurements of the same region of the atmosphere at the same time. is taking more about point measurements than the trend (how that fits with the 0.01 I don't know - maybe a C to F conversion error). I don't really know what they mean by that - balloons don't even read to that degree of precision, as I recall.
But more, what is of more interest is the uncertainty in the trend line through the data. That has various errors bars depending on what you oook at - data uncertainty is only a small part of that. Or at least it would be, if the data were accurate.
So you can say that S+C took their data accuracy to be generated by the best efforts of their algorithms, assuming their algorithms were 100% correct. Obviously they were wrong about that, but the problem is: how do include actual mistakes in your code in your error estimates? You can't -W]
The spinning Earth animation was fancy for 1997. Here's another NASA press release from earlier that year.
http://science.nasa.gov/science-news/science-at-nasa/1997/essd5feb97_1/
It was (and still is of course) all the fault of those pesky computer models.
For those late to the dance, it was the Prabhakara analysis which was more limited, but more robust that really forced the UAH team to start looking for glitches. IEHO of course
[A good point. And one that wikipedai seems to have forgotten, if it ever knew it. http://en.wikipedia.org/w/index.php?title=Satellite_temperature_measure… - feel free to join in -W]
> but the problem is: how do include actual mistakes in your code in
> your error estimates? You can't -W]
Actually that may be possible if your data has redundancy... test for mistakes above a certain size, and analyze the sensitivity of your outcome to smaller errors. Very common in geodesy.
The problem with the satellite data is of course its lack of redundancy, esp. regarding this particular kind of error... eggs, meet basket.
William, I agree that the initial error was probably unintentional, but as to characterizing what happened later I'm informed by their (mainly Christy's) subsequent record on other work ;))
You have just experienced another Turing Test brought to you by the 'film Izle" spambot, which has some 16,200,000 postings indexed by Google today; was anyone fooled?
[It was a bit odd, but I did indeed let it past. I suppose I'd better de-link it -W]
Yes, I was, i was certain it was less than 1,600,000 postngs :)