
This is about the paper of the same name by A Dai, available from http://www.cgd.ucar.edu/cas/adai/papers/Dai-drought_WIRES2010.pdf.
To keep things in one place, here is the abstract:
This article reviews recent literature on drought of the last millennium, followed by an update on global aridity changes from 1950 to 2008. Projected future aridity is presented based on recent studies and our analysis of model simulations. Dry periods lasting for years to decades have occurred many times during the last millennium over, for example, North America, West Africa, and East Asia. These droughts were likely triggered by anomalous tropical sea surface temperatures (SSTs), with La Ni Ëna-like SST anomalies leading to drought in North America, and El-Ni Ëno-like SSTs causing drought in East China. Over Africa, the southward shift of the warmest SSTs in the Atlantic and warming in the Indian Ocean are responsible for the recent Sahel droughts. Local feedbacks may enhance and prolong drought. Global aridity has increased substantially since the 1970s due to recent drying over Africa, southern Europe, East and South Asia,
and eastern Australia. Although El Ni Ëno-Southern Oscillation (ENSO), tropical Atlantic SSTs, and Asian monsoons have played a large role in the recent drying, recent warming has increased atmospheric moisture demand and likely altered atmospheric circulation patterns, both contributing to the drying. Climate models project increased aridity in the 21st century over most of Africa, southern Europe and theMiddle East, most of the Americas, Australia, and Southeast Asia. Regions like the United States have avoided prolonged droughts during the last 50 years due to natural climate variations, but might see persistent droughts in the next 20-50 years. Future efforts to predict drought will depend on models' ability to predict tropical SSTs.
As I've said elsewhere - I'm sure I have, errm hold on a moment, oh well can't find a good example never mind - the most severe problems from GW are likely to be ecological impacts, and a good way of getting such impacts is to have a nice big drought.
Anyway, on to the paper. Here is probably the most important figure, fig 10:
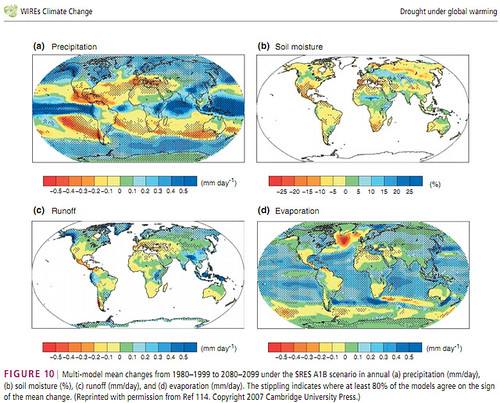
what's wrong with this pic? Mostly, it is an unthinking average of all the IPCC models. Don't do that! Some of them are poor. Also, look closely at the stippling: those areas stippled are where 80% or more of the models agree on the *sign* of the change. Not on the magnitude, just the sign. One could make a fair argument for asserting that outside those regions (or some other defined threshold) the results should be ignored, as too uncertain.
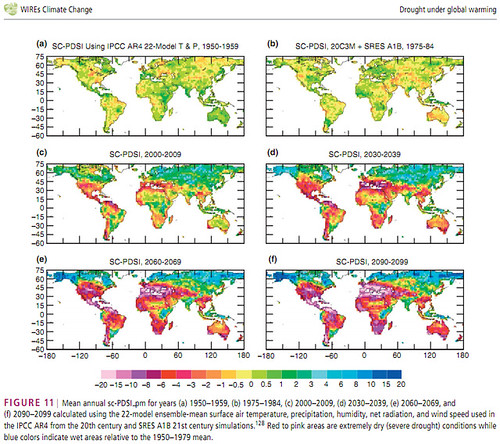
This is followed by fig 11, which is the actual PDSI for various periods:
Those are the most important pix, assuming that what you care about are the projections for the future. And since I got this from CP (via SB, if I recall correctly) that *is* what people care about. CP are basing their article on the UCAR press release I think.
Before I go any further, I suppose I'd better confess that for a variety of reasons, some reasonable and some less so, I don't much like the paper. I'll discuss some of them (for example, there is the almost-complete-waste-of-time EOF analysis around fig 6; everyone does an EOF analysis nowadays, it is fashionable).
Notice that CP, and UCAR, have replaced "PDSI" (Palmer Drought Severity Index) with "condition" in their pic, though the press release does at least tell you they have done so. I don't know exactly what this variable is; some combination of Precip, Potential Evap, and maybe other stuff: Dai says "The PDSI is the most prominent index of meteorological drought used in the United States... It incorporates antecedent and current moisture supply (precipitation) and demand (PE) into a hydrological accounting system. Although the PDSI is a standardized measure, ranging from about â10 (dry) to +10 (wet), of the surface moisture condition that allows comparisons across space and time, the normal climate conditions tend to yield more severe PDSI in the Great Plains than other US regions." Yet UCAR says "A reading of -4 or below is considered extreme drought": yet the pix show *all* of France and Spain with PDSI below 10 in 2090 which (if I believed it, which I don't) would mean mega-severe drought for those regions. Quite a bit of the paper is trying to decide what drought index to use, or perhaps trying to justify their choice; or to try to show that various different produce the same answers. But there is clearly room for a great deal of uncertainty.
There is a lot of room for wondering if fig11 means anything: as Dai says We emphasize that quantitative interpretation of the PDSI values shown in Figure 11 requires caution because many of the PDSI values, which are calibrated to the 1950-1979 model climate, are well out of the range for the current climate, based on which the PDSI was designed. Nevertheless [we'll interpret it anyway]. Not knowing much about PDSI I really don't know how to evaluate this: using the index well outside its intended range might be meaningful; or it might not.
What *does* make sense about the paper? Mostly, fig 10 (despite my harsh words earlier) panel a: in a warmer world, the ITCZ (inter tropical convergence zone, on the equator as shown in the pic if not actually in reality, cos it moves with season, probably an argument for not using annual averages) gets stronger (hence more ppn) but so does the descending branch of the Hadley cell (and maybe broadens too) hence the drying in the sub-tropics (descending air is dry, of course). Naturally, none of that is new; see for example IPCC AR4 fig 10.6. But WTF is the massive decrease in evap just S of Greenland? That is sea / sea ice, so can only come from cooling. Do 80+% of models agree that just S of Greenalnd will cool? That seems very very odd. IPCC AR4 fig 10.8 shows a warming minimum there (probably cos it is a deep convection region).
Refs
* Floods in Queensland by Stefan Rahmstorf (chrome does a good translate into perfectly readable English)
* The Wild Weather of 2010 Trenberth, Masters and Cullen (but I really don't believe " that the climate is beginning to grow unstable")
- Log in to post comments
SIEMENS to the rescue.
http://www.pennenergy.com/etc/medialib/platform-7/pennenergy/site-image…
This
is what
they really
want to do
to all the remaining mountains
we have left, just to display the crosses
of a sacrificial doomsday religion,
access roads and
power lines
included.
Is it not the case that the AOGCMs don't do regional analysis very well? But a somewhat similar study for Argentina (and therefore also Chile) used the Hadley Centre model only with the regional analyzer hung on the end. That study produced rather similar results for that portiion of South America, although not in detail.
There is a somewhat similar global study done recently from USGS which used fewer of the big AOGCMs. The conclusions differed noticably only on the Tibetan plateau. And there are now many different studies predicting that the southwest of the USA will seriously dry up; others for the Mediterrean lands. But somehow Dr. Dai's study was, for me, the most striking.
Well I found the EOF analysis quite interesting as a reasonably convincing (to me at least) index of ENSO variability also falls out of this analysis. I was impressed by this paper as it is the first time I've seen an analysis which seems to confirm real changes in drought conditions are already happening as a result of AGW.
[I thought that section was rather weak; maybe I'll have another look -W]
However what is curious is that the EOF 2 seems to have a trend towards more La Nina like conditions over time, although it is hard to tell for sure comparing two very squiggly lines. It would strike me as odd if an EOF analysis captures the impact of AGW in both EOF 1 and 2, as that doesn't seem what orthonal should mean?
[Orthogonal is a purely mathematical property of the EOF vectors. It seemed to me that finding El Nino in EOF 2 was sort-of "fun", but largely irrelevant to the article -W]
One issue I have is that the PDSI index will become more droughtlike as temperatures increase if rainfall does not increase (due to increased evaporation). The PDSI shows good correlation with streamflows over historicall data at a specific location, but over shorter periods of time drier conditions tend to coincide with hotter conditions (less evaporative cooling/cloud etc).
I'm not sure if the PDSI has been tested for a situation where temperatures increase and precipitation stays constants, which is what appears to be the overall trend in Australia (ignoring significant regional variations), and may overstate the impacts of drought in such situations?
One issue I have is that the PDSI index will become more droughtlike as temperatures increase if rainfall does not increase (due to increased evaporation).
http://climateprediction.net/science/pubs/nature_insight_120902.pdf
Fig 2 shows increases in precipitation well short of the ClausiusâClapeyron relation but still clearly increasing with temperature. (I would say due to increased carrying capacity of atmosphere to hold water rather than increased evaporation.)
"The red triangles in Fig. 2 show the long-term equilibrium global-mean near-surface warming, DT, and precipitation increase, DP, in response to doubling CO2 in a number of atmospheric models coupled to âslabâ (thermodynamic mixed layer) ocean models44,45. They appear to lie, to a reasonable approximation, on a straight line46 with slope 3.4% precipitation change per kelvin (much less than the 6.5% per kelvin implied by the ClausiusâClapeyron relation44) and intersecting the temperature axis around 1.4 K."
Of course there will be variations allowing things like Australia warming up without precipitation increase but then surely the PDSI should become more drought like for that region?
South of Greenland: probably decrease of wind speed, in addition to minimal increase of temperature. IPCC AR4 WG1 Figure 10.9 shows that surface pressure increases in North Atlantic, especially in winter (DJF). It probably means less storminess (extratropical cyclone activity).
I would echo Kooiti, I remember once looking at a global map of wind (energy) potential, and just south of Greenland was a huge spike in average windspeed. So if that slows down, it could have a substantial effect.
Averaging all the models is a sensible strategy unless you are very confident that you can identify a set of models which are substantially poorer than the others...which as far as I can tell, no-one really believes they can do, with the possible exception of excluding the Chinese model...
[I'm not convinced that just averaging them all makes sense, especially when there are good metrics for distinguishing poor ones. E.g. http://scienceblogs.com/stoat/connolley_bracegirdle_07_AR4_Ant_assess.p… -W]
William, good review. You might be interested in this nice interview with Trenberth, Masters a Cullen about the weather extremes of 2010:
http://www.loe.org/shows/segments.htm?programID=10-P13-00051&segmentID=3
Masters says: "This year makes me nervous, it really does."
James Annan doesnt that contradict your comments on ensemble means you made on your site?
Alexander Ac, doesnt look good does it particularly when Mr Trenberth sounds concerned (I have always put him down as one of the honest sceptics, a bit like WC and James Annan.)
Two press articles today on food and drought.
http://www.guardian.co.uk/business/2011/jan/05/world-food-prices-danger…
http://www.ft.com/cms/s/0/51241bc0-18b4-11e0-b7ee-00144feab49a.html#axz…
@ eachran
Thanks for the Guradian link. It's good to see ArecBalrin on form.
On the subject of drought, does anyone know what's happening with Barton Paul Levenson's paper on the subject?
Hang on, let me get my popcorn.
[Sorry to disappoint you. I didn't feel like a flamewar right now, so I deleted it and mailed him a request to repost with more substance -W]
J Bowers, I got a copy from BPL. I can't recall the details, but it had a conceptual problem that made it unpublishable. M&M and co. have a hard time doing amateur climate science, but I'm afraid the same is true going the other way.
William, would it be appropriate for a review paper to be selective about the model results it uses?
[Ah, but that is where the paper title is just a tad deceptive. This is a "review" of some basic concepts and stuff, but the results on future drought aren't a review at all - they are the authors own new work (using IPCC models, of course, not his own runs) -W]
@ Steve, thanks for the info.
@ William, I wasn't looking for a food fight, just anticipating one. Sorry.
[Thats all right. I was only apologising for spoiling the fun :-) -W]
I believe my comment is in line with what I've blogged about before. The mean will certainly outperform most, and maybe all, individual models, and it will equally outperform the mean of most subsets of models (but probably not all of them, given that there are so many). William's point is correct only to the extent that "rubbish" models can be reliably identified. All models are wrong, of course, so they are all "rubbish" by some measure...
(Incidentally, my recent work with the IPCC ensemble would mark me out as rather less sceptical than the mainstream of climate scientists, in that our analysis shows the models in a better light than others have recently claimed.)
i've been assuming them models are counting on the faster/increased volume of the east greenland current to produce that decrease of evaporation. them could be wrong on this since last 2 winters have been somewhat unusual gulfstreamwise.
Re BPL's paper on drought and collapse of civilisation as we know it (if that's not too oversimplified a synopsis): this is what he had to say on the matter on 4/1/11.
[Sounds dubious to me. However, I'll read the paper when it comes out -W]
>Re "it will equally outperform the mean of most subsets of models" & "William's point is correct only to the extent that "rubbish" models can be reliably identified."
Surely Williams point extends to what is written in the paper:
"The all-model average provides a reasonable pattern, but with too small a warming, although the skillweighted model average does better."
So surely it isn't about whether the model mean outperforms mean of most subsets but about whether it outperforms a skillweighted model average.
Is there too much difference between skill at short-term skill measures and skill at longer term timeframes or is there a different issue for you to stick to your "no-one [except William?] really believes they can do" ?
James Annan, ta for your explanation and for the moment I await your most recent research with interest but......
When I started to look at global heating many years ago and thanks to WC (who shall always be remembered by me as Father William even though he's the same age as my own children and their husbands)I set out on a journey (no not like Tony Blair)starting off with the IPCC but quickly extending to other bits and pieces. And, on that journey I sorted out the wheat from the chaff. Pretty easy to do in most instances and if you have a science background not too difficult to do with a bit of catching up on the theory and practice.
James Annan, I read your ensemble mean paper and I thought that this was correct though with some doubts (dont ask me what, because my brain works on the rational and intuitive level at the same time). Are you saying to me that I should get my books out and refresh all the stuff I did at Uni on stats and related stuff : do they still have Mood and Graybill on courses today? Crumbs, I am not too old to start again but you youngsters ought to have taken us to a higher and more certain stage by now.
This is not a criticism : I thought that your stuff on Bayes and priors was very good.
Ah, an amendment...
@ Steve Bloom: Thanks for the info.
@ P Lewis: Oh crap!
I'm sure BPL would understand what I mean. The Skeptickz response to the paper, along with BPL's inevitably "unambiguous" responses, will be worth getting a truckload of popcorn in for. ;)