
 Well, no-one has said what I wanted to say about this, so I thought I should. Click on the image for P3's take. This is about Shaun A. Marcott, Jeremy D. Shakun, Peter U. Clark, Alan C. Mix's latest in Science. If you want to read some stupid things said about it, try Curry (surprise) or if you prefer your stupidity super-sized, then WUWT. And indeed, if you want to read drivel, why bother with watered down gruel?
The abstract has something for everyone:
Surface temperature reconstructions of the past 1500 years suggest that recent warming is unprecedented in that time. Here we provide a broader perspective by reconstructing regional and global temperature anomalies for the past 11,300 years from 73 globally distributed records. Early Holocene (10,000 to 5000 years ago) warmth is followed by ~0.7°C cooling through the middle to late Holocene (5000 years ago), culminating in the coolest temperatures of the Holocene during the Little Ice Age, about 200 years ago. This cooling is largely associated with ~2°C change in the North Atlantic. Current global temperatures of the past decade have not yet exceeded peak interglacial values but are warmer than during ~75% of the Holocene temperature history. Intergovernmental Panel on Climate Change model projections for 2100 exceed the full distribution of Holocene temperature under all plausible greenhouse gas emission scenarios.
If you're the GWPF, then your headline is Earth cooler today than 28% of the past 11,300 years. If you're Timmy getting climate wrong as usual, its What Excellent News: Earth Warmer Than in Most of the Past 11,300 Years. I'd probably go with RC's take What If from 2005. But I'll continue anyway.
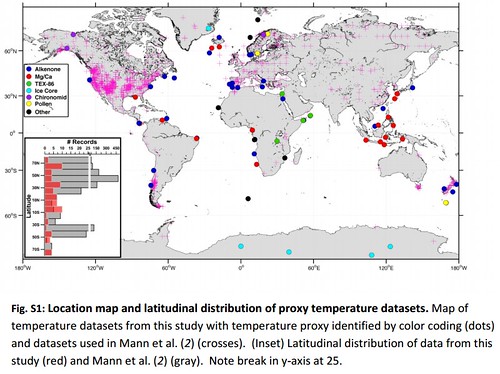 The first thing that strikes me is that the error estimates look insanely tight, and constant. In fact they aren't really error estimates, I think they are The gray shading [50% Jackknife (Jack50)] represents the 1s envelope when randomly leaving 50% of the records out during each Monte Carlo mean calculation. however I think people are inevitably going to interpret them as error estimates. And yet they don't include sampling bias or any systematic problems with the datasets.
The second is the sparsity of sites, compared to Mann et al. I'd also whinge about the latitudinal bias of the the sites, too, except as the figure shows that also applies to Mann et al. too.
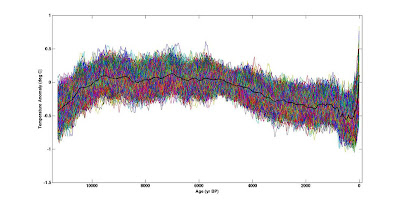 Point three would be caution in using figure S3, as EW does. That's not all the records stacked together, as it rather looks like at first (it would be astonishing if it were, far far too tight; compare this).
I'd also read Michael Mann's comments in Andy Revkin's piece, in conjunction with pondering figure 2 I/J/K. Is the warmth biased by Northern high latitudes? I don't know.
That wasn't a terribly insightful analysis, was it? Well, its early days yet. That was mostly what I wanted to say: don't over-interpret this picture or paper. I'm sure there's a lot of more informed comment to come.
I cannot leave you without presenting what may become one of my favourite oh-dear-the-poor-darlings comments, from WUWT of course:
Although a list of sources of the data from the 73 sites is provided in an appendix, nowhere is any real data presented, so assessing the validity or accuracy of the original data is not possible without digging out all of the source papers.
If you need that interpreted, you're lost, so I won't try.
Refs
* Global Temperature Change — the Big Picture
* The Tick - Tamino again
Where I struggle with all of this is if it is so hard to estimate the global average temperature at one specific and particularly important remote point in time - namely, the LGM, where estimates have varied from I think as low as 2 K to as high 6 K with Annan and Hargreaves and the forthcoming AR5 converging on 4 K - how could we in principle know the global average temperatures all the way back to the beginning of the Holocene with any greater accuracy? In other words, if the LGM estimates have varied by +/- 2 K how is it that our estimates of other remote periods seem to be so much better constrained?
The comparison map with Mann et al. 2008 sites is a bit misleading because the amount of proxies available in that database reduces sharply as you go back in time. At 1000CE the spatial coverage of Mann et al. proxies is considerably worse than Marcott et al.'s. The constancy of the error estimate is due to the relative constancy of spatial and temporal coverage - there is very little proxy record drop-out over the study period.
And yet they don’t include sampling bias or any systematic problems with the datasets.
They do discuss some issues along these lines in the SI and seem to conclude that they shouldn't make much difference beyond their stated uncertainty ranges.
Regarding sampling bias, they test this by comparing averaged instrumental surface temperature data near the proxy locations with published global averages and finding a good match. They also sample the output of a Holocene transient climate model run at the 73 proxy sites and compare to the global average from the model - again, a good match.
I'm not sure how valid this is as a test when considering the different factors involved in millennial scale climate changes versus the globally-coherant warming over the past century.
For example, in the SI it is noted that some North Atlantic proxies exhibit very large trends from the early-to-mid Holocene to present, on the order of 5 - 8ºC temperature change. When this handful of proxies is removed from the stack the global average is significantly altered with a much flatter Holocene. This indicates their global average is being heavily weighted by only a small number of proxies with very large trends. The question is whether or not these trends (assuming they represent real climate changes) were counterbalanced by warming in unsampled regions. The climate model used for comparison does not produce such trends in these locations, so it doesn't work very well as validation for their sampling.
One thing I haven't seen mentioned regarding the recent period is that the last data point in the graph above is 10BP i.e. 1940. What I can't get my head around is whether the proxy data represents a single moment in time, or is inherently an average over a long period. For example, if the age of a proxy sample in a record with a 100-year resolution is determined to be 10BP, would that mean the datapoint represents only the weather/climate of the year 10BP or would the nature of the proxies inherently mean they represent the climate over a 100-year period around 10BP?
Alex: you write as if the LGM (last glacial maximum, 20-25kya) is more recent than the start of the Holocene (12kya). Can you clarify?
WRT MBH, also remember that they grouped large numbers of the tree ring proxies that were in the same areas to avoid overwhelming sparser ones. Just from looking at that map tho it looks like the southern hemisphere is much more evenly represented in the new paper
Alex,
Part of that is a simple matter that when larger numbers are involved it tends to mean larger absolute uncertainty, all else being equal. Relatively speaking, a 0.4 +/- 0.2ºC change is equivalent to a 4 +/- 2ºC change, assuming errors scale linearly.
Haven't read the paper... but what I always want researchers to do is to test their methodologies on artificial datasets... eg, stick a modern warming episode into the middle of an artificial time period (maybe assume that it cools down as quickly as it warmed up), and see if the method picks it up. If you're really fancy, apply the method to 5000 year climate model runs...
(usually, I want the septics to do this when they come up with a novel method that shows that climate sensitivity is less than 1 degree or whatnot - and I say to them, show me that your method can diagnose the sensitivity of a climate model, and then we'll talk...)
OT sorry.
[I'm going to make you a special sea ice post so we don't lose stuff -W]
Good news PIOMAS volume is up on last year and nearly up to 2011 level.
2011 day 60 19.981
2012 day 60 19.812
2013 day 60 19.945
One reason for ice growing thicker faster is heat can be lost faster through thinner ice. If the ice has caught up in thickness that reason partly disappears.
So is any further thickening relative to 2012 likely to be a result of less snow cover? If so, the lower snow cover might mean lower albedo and a faster start to the melt season? The frozen over cracks this year certainly look like they have lower albedo.
Got a feeling there was a diagram showing evolution of ice thickness and snow thickness after instantaneous removal of sea ice in your Schroder and Connolley 2007 paper but I am struggling to find it now. Could you send me a copy of the paper?
Apples and Oranges.
I wonder at the quality of critical thinking in science journals. The past temperatures are averaged over >70 years, including the ice core. The post-1880 data, instrument data, has at most a few years of smoothing. We could easily have had a larger range in the past if we had the high frequency data of the present.
Within the limits of the study, this study is fine. It is the extrapolations that make no sense. Perhaps science journals require a lot of controversy these days to sustain enough interest in them to survive.
Doug,
I haven't read the paper, and I suspect you haven't as well. The purple line looks like it has the same smoothing over the entire time period. Are you certain that there is a break somewhere in that curve with different averaging times before and after?
1) Some people desperately want there to have been big high-frequency fluctuations were unnoticed, as though that would make the post-IR warming be natural. Sadly, that would require repeal of conservation of energy and everything known about the physics of greenhouse gases.
This like claiming a fire was not arson, because a fire was started by a lightning strike, even though police found the gas can at the scene and have the arsonist in jail.
2) But back to conservation fo energy.
Small temperature jiggles can be noise.
Big ones don't just happen magically and they have characteristic timescales.
Milankovitch cycles: many thousands of years.
Big volcano: a few years
ENSO jiggles: a few years
etc.
Then there are the abrupt changes, such as Dansgaard-Oeschger, Bond, the 8.2K event, etc, whose biggest effects seem most visible in the North Atlantic. IF one were going on now, we'd have noticed, especially WMC in the UK.
Of course, we also know the general increase in Ocean Heat Content is not due to any big increase in solar insolation.
3) It is certainly possible for the increase in CO2 (and CH4) post-IR to cause most of the post-IR temperature rise ... but for an event to be invisible to studies like Marcott, et al:
a) Something has to *make* the temperature rise on a century scale
b) Then it has to go back down.
CH4can jiggle faster (as it had big drop during the Younger Dryas), but CO2 is *very* hard to move: during the last 10Ky it pretty much stayed between 260 and 280, adnd it simply does not drop far quickly.
The biggest/sharpest drop I know of in last 2 millenia was the 9 ppm drop into 1600AD, as per Ruddiman's explanation.
If you look at a slopes curve over last 2000 years: focus on the green line, which shows a regressiojn slope for 75 years, and not until ~1600AD does that slope exceed [-.1, .1].
Let's see, it took a big civilization burning lots of fo raise CO2 from 315ppm in 1958 to the current 396(?). That's a slope of roughly (but given the curve OK) (396-315)/(2013-1958) = ~1.47 ppm/year, which is far off the top of the slopes graph. The ice cores have no record of an 80ppm blip any time in the last 15,000 years. Even ice-age termination didn't do that, and the YD flattened it a while, but that's all. From 15,000 to 10,000 was only 220ppm tp 265ppm. In any case, CO2 drops much slower than it rises.
So, if someone wants to claim there were century-scale ups-and-downs (and statistically, there could be), they have to give a *physics* explanation, not handwvaving on statistics. There is no trace in the relevant record of a 80ppm rise and then fall ... so if there was a magic bllip, it wasn't CO2.
All this is reminiscent of the wishful thinking about E. G. Beck's wild CO2 fluctuations that magically stopped when people started doing modern measurements.
So, I'm certainly open to suggestions that:
a) Can explain century-scale fluctuations, either up-and-down or down-and-up
b) Obey laws of physics
c) Are consistent with other paleo data.
Climate variability is an interesting problem ,but sadly the usual displays (a line with some kind of uncertainty zone) can confuse people. It may constrain a given century to be in some (large) zone, but physics and other data further constrain the actual paths. That is, it is very hard for reality to go from the low edge one century to the high edge the next, and then back to the low edge. If people think that's possible, they have to propose specific mechanisms ... and why we just haven't seen any such effects for millenia.
[This is a good point. I think you can go further: if there had been a century-scale blip, caused by some forcing that is invisible to all our proxies, we'd still have seen it in stuff like CO2, which you'd expect to respond. And we do have enough rez on CO2 -W]
re: " I think you can go further:"
Good point, but I thought Jeremy Shaken had already mentioned that in thios comment at Dot.earth.:
"Just a quick point here. I state in the interview that we can't be sure there aren't any abrupt global warming blips during the Holocene similar to the current one due to chronological uncertainties and the relatively low time resolution of our global temperature reconstruction. It is worth considering though that we do have several high resolution proxy climate records from various regions around the world (think ice cores), and if abrupt global warming events happened in the past, then we might expect these local records to show them.....but my sense is they don't. So, this isn't hard and fast proof that there weren't any abrupt global events like today during the rest of the Holocene....but if I had to lay down a bet, it might make me place my wager on that side of the argument. "
SO, he didn't say CO2 or CH4 specifically, but obviously they are relevant.
I was trying to get at a different point:: even if the ice-core resolution, if you want temperatures to make major blips, *both* up and down, you need to have physics that makes that possible at the specified resolution.
Of course, for the current rise, you also have the gremlin/leprachaun problem:
gremlins to provide an unknown mechanisms for the rise
leprachuans to make GHG-based physics go away
Oops, I meant "even if the ice-core resolution were no better than a few hundred years"
Hi all,
Does anyone here care to comment on claims appearing at skeptic blogs that -
- a comparison with Marcott's Ph.D. thesis shows no uptick in the 20th century in a figure similar to Marcott et al.'s Fig. 1c. Is there an innocent explanation for this?
- Willis Eschenbach has claimed that 10% of Marcott's proxies fail his own criteria for inclusion. Is he right?
- Marcott has apparently written to Steve McIntyre, saying he “clearly” stated that the 1890-on portion of the reconstruction was “not robust”. This strikes me as extraordinary - what would be the point of this uptick be, then, other than to allow newspaper headlines like NYT above to claim - "Scientists Find an Abrupt Warm Jog After a Very Long Cooling"?
[Do you mean "In addition to the previously mentioned averaging schemes, we also implemented the RegEM algorithm (11) to statistically infill data gaps in records not spanning the entire Holocene, which is particularly important over the past several centuries (Fig. 1G). Without filling data gaps, our Standard5×5 reconstruction (Fig. 1A) exhibits 0.6°C greater warming over the past ~60 yr B.P. (1890 to 1950 CE) than our equivalent infilled 5° × 5° area-weighted mean stack (Fig. 1, C and D). However, considering the temporal resolution of our data set and the small number of records that cover this interval (Fig. 1G), this difference is probably not robust."?
It seems weird that McI is incapable of reading the paper - does he really need personal email correspondence for suchlike? But it would probably also be a good idea for you to read it too, if you're interested.
As for WE, most of that looks like drivel. He starts "I hate it when people don’t show me their starting point..." and ends "[eight] of the proxies don’t meet the very first criterion, they don’t have sampling resolution that is better than one sample per 300 years." So, I've no idea which 8 he means. I don't trust him well enough to bother look myself, but if you care enough to list those 8 I suppose someone might look. Anyone want to bet that if you do, WE will turn out to be quibbling tediously?
Marcott's thesis: you're asserting that the current paper isn't identical to an earlier paper? Is that supposed to be odd? -W]
It would be quite surprising if the figures in Marcott's Ph.D. thesis exactly matched those in a later paper - it would indicate that no new research had been done in the interim.
As to the 1890-on portion, Marcott et al clearly states the reasoning as to the recent endpoint reconstructions, and why they do not consider it robust. I will note, however, that given multiple paleo reconstructions covering the last 2000 years, there is a considerable amount of information available for the temperatures of the last 200 years.
A far more interesting question (IMO) is in regards to the time resolution of the reconstruction WRT recent warming, but I agree with Shakun that we would probably have seen evidence of such in the higher-resolution proxies such as the ice cores. Not to mention the lack of _any_ plausible physical cause for both a natural large excursion and rebound over the required time frame.
Alex, allow me to quote Tom Curtis on Skeptical Science:
"the graph ... is not the only one to have altered between thesis and paper in Science. Specifically Fig 1 G (Science; Fig 4.3 C in the thesis) also differs. That figure shows the number of proxies available at different time periods. Most importantly, in the thesis it shows less than 10 proxies extend into the twentieth century. In contrast, in the Science article, shows 20 proxies available at the same time interval. As the same proxies appear to be used in each, this suggests that either Marcott has recieved additional, more recent data for several of the proxies, or that the interpolation using RegEm (as discussed both in paper and thesis) has been more extensively applied. "
http://www.skepticalscience.com/oilprice-watts-interview.html#92105
It's unsurprising to see people reacting to McIntyre's dog whistle again.
Of course, in some sense titles have been silly.
It's not that people suddenly found an abrupt warming (this study didn't really add anything to that), it's that it extends our understanding further back....
One would expect their marine archives to correlate better with total Ocean Heat Content than land-based ones, and it is even harder to understand the physics of major up and down century scale OHC blips than surface temp jiggles.
Of course, given Milankovitch and Ruddiman, Marcott, etal curve isn't particularly surprising, but it is a nice extension.
Considering that a lot of attention has been paid to the fact that the proxy reconstruction effectively filters out high frequencies, is it just a coincidence that the fourth author goes by the name of AC Mix?
The Holocene temperatures of the James Ross Island ice cap:
http://www.nature.com/nature/journal/v489/n7414/fig_tab/nature11391_F2…
Note the general similarity to the Marcott et al. study.
As McIntyre's latest analysis shows, Marcotte have switched the dating of half of their proxies from the original authors' values to different Marine09-based values. The original authors of those proxies will have something to say about that. Warning to you all -- how tightly you hitch your wagon to this junk-science paper is a direct measure of how far you will go down with it.
[If you think the "secret" of re-dating comes from "McIntyre's latest analysis" you've been sold a pup. The re-dating is in the SOM itself: The majority of our age-control points are based on radiocarbon dates. In order to 67 compare the records appropriately, we recalibrated all radiocarbon dates.
So I'm curious - who sold you this pup? And why didn't you bother check the original? -W]
A.R:: "Connolley ... blistering critique"
-- who's been blistered? by what?
A.R.: "McIntyre ... constructive and important questions"
-- A.R. is not referring to McI's 'robust' misreading, I hope?
Wow, you really are clueless, aren't you? Who said it was a "secret"? -- only you used that word. I do have the original data -- and your notion of radiocarbon date usage is wrong also, that was used only to align the proxies -- Marcotte's dates are in his main data -- and are generally different than the dates given by the original authors of those proxies. Some proxies have been promoted from medieval times to the present -- others demoted from 2000AD to 1950AD without a shred of justification. All in the service of getting a shiny new hockey stick -- "Brooklyn Bridge" brand -- to be sold to you enthusiastic blind lemmings, ha ha!
> the present — ... 1950AD
Would that be all of them?
NZ Willy.
So all the tempearatures records are wrong then, including UAH. and RSS?
The earth is not warming?
So we know where you stand.
Just to nice to you poor lemmings, here is Marcott’s snake oil in brief: 73 proxy sequences were combined into an aligned temperature record for 9400BC – 1950AD. Each individual data point has an uncertain age — the earlier the data point, the greater the age-uncertainty — but the age-uncertainty at 1950AD is zero. So the total proxy record was perturbed 1000x into 20-year bins, with each data point’s perturbation bounded by that data point’s age-uncertainty. Therefore the whole show was homogenized, except for the last 20-year bin (1950AD), which because of its age-uncertainty of zero, shared no data with its neighbors.
Thus the perturbation method guaranteed an outcome in which natural variations were smoothed out everywhere *except* for the last 20-year bin of 1950AD. Then all that remained was to use data selection and re-dating to ensure that the 1950AD data was of the warm variety. Once you got that data, push the switch, VROOOM, the whole 11,400 years’ data is homogenized smooth except for the 1950AD record which the data grinder can’t reach — results guaranteed!
Now all you lemmings can make a more informed decision about jumping over the cliff with Marcott's paper -- which I'm sure you will do. Cheers.
I'm going to wait for something from Tamino on that bin thing.
Marcott is said to be preparing a FAQ to address criticisms. Has anyone seen it? So far, Tamino seems uninterested. Nothing at realcimate yet. There' a post at Bart's today.
The same mistake is being made about the Wheelchair that charletins make about the Hockey Stick. The back of the chair (the blade) is instrumental. If Marcott, et al is right at ~1850 or a little later, the rest, as they say, is instrumental history.
[Agreed. I'm not even bothering to read the WUWT / CA stuff, because its clearly just fiddling with unimportant details, and that's even if they're entirely correct, which is unlikely -W]
Funny, I somehow missed the 17-year pause in warming, in your "instrumental blade".
It's there, you just missed it.
I predict arctic largely ice free by 2020 CE.
I don't understand why it is so hard to understand the basic problem, with the graph, at least: That last spike is about the past 150 years, right? How can we KNOW that there weren't previous spikes that big? And, since I might not have a follow-up, if you cannot KNOW it, why publicize it?
[I agree its a problem. If you're interested in the answer you can read some of the comments above you. JM at #11 and my reply, for example (from which you'll see that I don't think a spike is plausible). If you've been reading the septic blogs, perhaps you can answer this: from my skimming of htem, I think they've been focussing on trivial, rather than more important stuff: like, what are the error bounds for the curve, and (to rephrase your point somewhat) how big a spike could have escaped detection? -W]
Weary Wary Amateur,
Actually the spike on the graph at the top is produced by just a single datapoint representing a 20-year timestep around 1940 (the final datapoint in the series). The previous 1920 datapoint is at -0.1. As the paper notes, the recent period shown on the graph is not robust. Instead we would look at instrumental data to find the temperature change over the past 150 years, though the problem with a direct comparison is, of course, a big difference in temporal resolution.
A possible exercise which could be tried is to obtain long instrumental data from stations near the proxy sites (where possible, tricky for Antarctica), simulate resolution of the proxies by converting to 2 or 3 datapoints representing multi-decadal averages and see what you get. For comparison you'd have to throw out proxies with >100-year resolution at any point in its history, which would probably make the reconstruction less robust.
One issue I've noticed with the study is that it uses mostly marine proxies, which existed at various depths in the ocean. AIUI millenial scale changes to thermohaline circulations can cause shifts in vertical temperature distributions, and also changes in seasonality.
For a proxy at a fixed location, particularly one with a seasonal bias, this might cause a significant temperature trend which does not relate to the annual average temperature at the surface. I think Mike Mann mentioned the possibility of seasonal bias due to high latitude insolation decrease but some of the larger trends occur in proxies in the mid-latitudes, which shouldn't be directly affected much by orbital insolation changes. These seem more likely to be linked to ocean circulation shifts.
That last spike is about the past 150 years, right? How can we KNOW that there weren’t previous spikes that big? And, since I might not have a follow-up, if you cannot KNOW it, why publicize it?
That's the point: we don't know, but we don't care about short spikes.
The current warming is not a spike, because it is expected to be stable. Even if emissions hit zero right now, the current anomalous warm is going to endure for centuries.
Marcott can't detect fast "blips" of transient warmth in the past, but it could have detected episodes of *stable* warming equivalent to the current one. Turns out, there's none. Hence, "unprecedented".
"[If you think the "secret" of re-dating comes from "McIntyre's latest analysis" you've been sold a pup. The re-dating is in the SOM itself: The majority of our age-control points are based on radiocarbon dates. In order to 67 compare the records appropriately, we recalibrated all radiocarbon dates.
So I'm curious - who sold you this pup? And why didn't you bother check the original? -W]"
Except that McIntyre's concerns have nothing to do with radiocarbon dating recalibration. They have to do with the arbitrary redating of core tops used for the alkenone series. First the fact that quite contrary to the firm assertion in the paper that “core tops are assumed to be 1950 AD unless otherwise indicated in original publication” some core tops which the original paper had indicated were dated as old as 1000 years older were dated 0 BP. Secondly core tops from series which genuinely did reach modern times were curtailed or time shifted back. In reality they showed a steep falling off, not the uptick seen in the final bizarre graph.
"Agreed. I'm not even bothering to read the WUWT / CA stuff, because its clearly just fiddling with unimportant details, and that's even if they're entirely correct, which is unlikely -W"
Hahaha, so you don't even know the criticisms, let alone have you assessed or addressed them yet your confirmation bias means you accept the paper without question.
[Yes, that's true: unless someone raises it here I'm not going to know what McI says: experience teaches me that wading through his stuff isn't worthwhile. you accept the paper without question - that's a weird thing to say. Did you read my post at all? It wasn't long or difficult. I think my take-home message is quite clear, but I'll repeat it for the hard-of-reading: "don’t over-interpret this picture or paper. I’m sure there’s a lot of more informed comment to come" -W]
Have you seen the data? Anyone can see that the proxies are clearly not even saying the same thing. Even the paper itself says that the only important part, that strange uptick that disagrees with every other study on this time, is not robust. Even the author himself states that the resolution before that time is only 300 years, so it could not possibly show any rise like the uptick except in that brief time where its resolution is greater.
[But... who cares? Even if you slavishly follow McI and assume the uptick is wrong, it doesn't matter. We already have good instrumental data for the last 150 years. That bit of the record is entirely uninteresting from the palaeo perspective -W]
It is utter nonsense. Its only positive contribution will be to bring rightful scorn on the climate "science" establishment, whose ready acceptance of it is strong evidence of their confirmation bias to the level of utter blindness to even the deepest flaws in anything that purports to show evidence of what they desperately want to see.
[Late update: you want to see http://tamino.wordpress.com/2013/03/22/the-tick/ I think -W]
toto
"The current warming is not a spike, because it is expected to be stable."
Errrmmmmm ... what? It is not a spike because it is expected to be stable? How can any serious man even type that sentence without balking. This is openly begging the question. You are saying it is important because it is not a spike, yet assuming it is not a spike because you think it is important.
"... but it could have detected episodes of *stable* warming equivalent to the current one."
[Not great phrasing by toto, I agree. However, you're being weak by addressing the weakest argument. Please read my, and JM's, arguements and address those -W]
Except that the only reason you assume the current one is stable is because of the very thing you are using this to prove - hence the logical fallacy of begging the question.
[I've deleted the end of your post, because it was nothing but deliberately provocative -W]
John Mashey
"Of course, we also know the general increase in Ocean Heat Content is not due to any big increase in solar insolation."
Indeed, because since the inception of the Argo system we know that it probably does not exist.
[That's wrong. If you're going to push stuff like that it would be best if you linked to the septic blog you got it from; otherwise the unwary might think you were getting it from real research -W]
> As the paper notes, the recent period shown
> on the graph is not robust.
That's not what the paper says.
That's what some second hand claims say, but it's being repeated by people who didn't read the paper.
The paper says there are two ways to get that last bit out of the data, and they give slightly different results.
The difference between the two methods is not robust.
The two different methods give almost the same result -- so similar that you can't call the difference robust.
Almost the same.
That better?
No Hank, the difference between the results of the two methods is large for the last 60 years (0,6 degrees), but due to few proxies and poor temporal resolution this difference is not robust. For the rest of the graph, the results are almost identical.
Doubting Rich: "Even the paper itself says that the only important part, that strange uptick that disagrees with every other study on this time, is not robust."
How can one possibly think that the only important part of a 11300-year reconstruction is the last century? How is it even possible to conceive such an idea?
Wow, the stink of hubris and over-excited sweat has made its way over here too. It turns out the only person (telford) who knows anything about core re-dating has said the the re-dating is NOT an issue. I understand the buzz-kill that this might be for folks but this does not mean ... how does DRich put it, oh yes..."Hahaha, so you don’t even know the criticisms, let alone have you assessed or addressed them yet your confirmation bias means you accept [McIntyre's new found expertise in core redating] without question."
Lars Karlsson says: "How can one possibly think that the only important part of a 11300-year reconstruction is the last century? How is it even possible to conceive such an idea?"
Er, because "Nature" *declined" the paper without the bogus uptick, and then "Science" *accepted* the paper after the bogus uptick was added? And then the bogus uptick was the only part to be publicized in all the subsequent press releases. [PAs redacted. Behave. Ditto anyone replying. But as to the substance: you're wrong. The recent uptick isn't interesting, present or not. As usual you're refless for any of your assertions. It would be better to provide some form of evidence, or even awareness that its required -W]
Doubting Rich or NZ Willy:
Can either of you explain why you believe anything McIntyre says? Do you believe is never wrong, either from incompetence or purpose?
(Evey once in a while I get interested in the psychology of belief patterns.)
Well, there should be a Google index that tracks how polarized search term popularity results are.
https://www.google.com/search?q=telford+marcott+climate
Take a look at the sources for the search results -- wtf and ca dominate not just the first page of hits but page after page of results. You'd think that nobody else had said anything.
Why you'd imagine this was an entirely one-sided interest.
John Mashey: If you can be troubled to scroll upwards, you will see my own independent analysis of why the Marcott uptick is phony. Using Marcott's method, you too can turn sequences of totally random data into a spurious uptick -- which is a sufficient demonstration that the method is nonsense.
A full text copy or two here and there can be found in the usual way with a Scholar search.
Figures: https://www.sciencemag.org/content/339/6124/1198.figures-only
Supporting material: https://www.sciencemag.org/content/suppl/2013/03/07/339.6124.1198.DC1.h…
Tamino posted on this here.
http://tamino.wordpress.com/2013/03/22/global-temperature-change-the-bi…
[Thanks; I'll add that to the refs -W]
> Lars Karlssen ... difference is large ... not robust
So if there were a robust difference, you could say it could be a large difference, but as the difference is not robust, it isn't.
At Tamino's, Richard Telford
and here's Taminon on <a href="The Tick