
 Turning aside from the moment from the strange world of Monkers we come to something that at least touches on science: to what extent did the atmospheric nuclear tests of the 50's and 60's affect the climate? It turns out that the answer is "hardly at all" and that the question isn't interesting; but I haven't seen the answer written down properly anywhere, or even considered properly, so I'll present what I've gleaned here (I'm almost certain this came up in sci.env in the Olde Dayes but I can't find it).
The latest folk to resurrect the idea that "all those bomb tests must have done something" are JN (Jo Nova) / DE (David Evans) in their BIG NEWS series. They're currently bogged down fighting off LS over TSI, but when that's beaten to death or quietly forgotten, they'll need to return to the question of "attribution". In their part VII their model - curve-fitting in my view, though they insist its a "physical" model though I don't think they know what that means - produces a stonking forcing from bomb tests (which in itself tells you their model is non-physical, even if you don't know any details). I'll inline their picture below.
Notice how the bomb-tests line in black is massively bigger than the volcanoes line, by a factor of something like 10. They've done that because they want their model to match the observed temperature changes; and they've decided to "model" the 50's-70's dip (which most folks ascribe to aerosol-from-fossil-fuel-use cooling) as being due to bomb tests. I've no idea why they thought this would be a good idea, and even they have realised that its just a touch problematic: While this is only an answer found by numerically piecing together the test yield data with the output of the solar model and the observed temperatures, it fits. Maybe the nuclear winter hypothesis is partly correct. We feel it is likely to overestimate the effect. Alternative causes for a cooling influence during the 1950s to 1990s could be pollutant aerosols and/or whatever caused global dimming, or even the Pacific Decadal Oscillation (PDO). With no data that quantifies their effects, the total climate model only had the nuclear bomb yield data to work with, but it is remarkable that the piece that fits the puzzle quite well is the atmospheric nuclear bomb test data.
JN attempts some kind of defence of the bomb idea: You’ve [that's not me, BTW - W] called the contribution of the atmospheric bomb tests a fudge factor but you haven’t actually provided any reasons why 440Mt of explosions wouldn’t have some cooling impact. The question then is how much of an impact is reasonable. We provided two papers with estimates in the same ballpark.
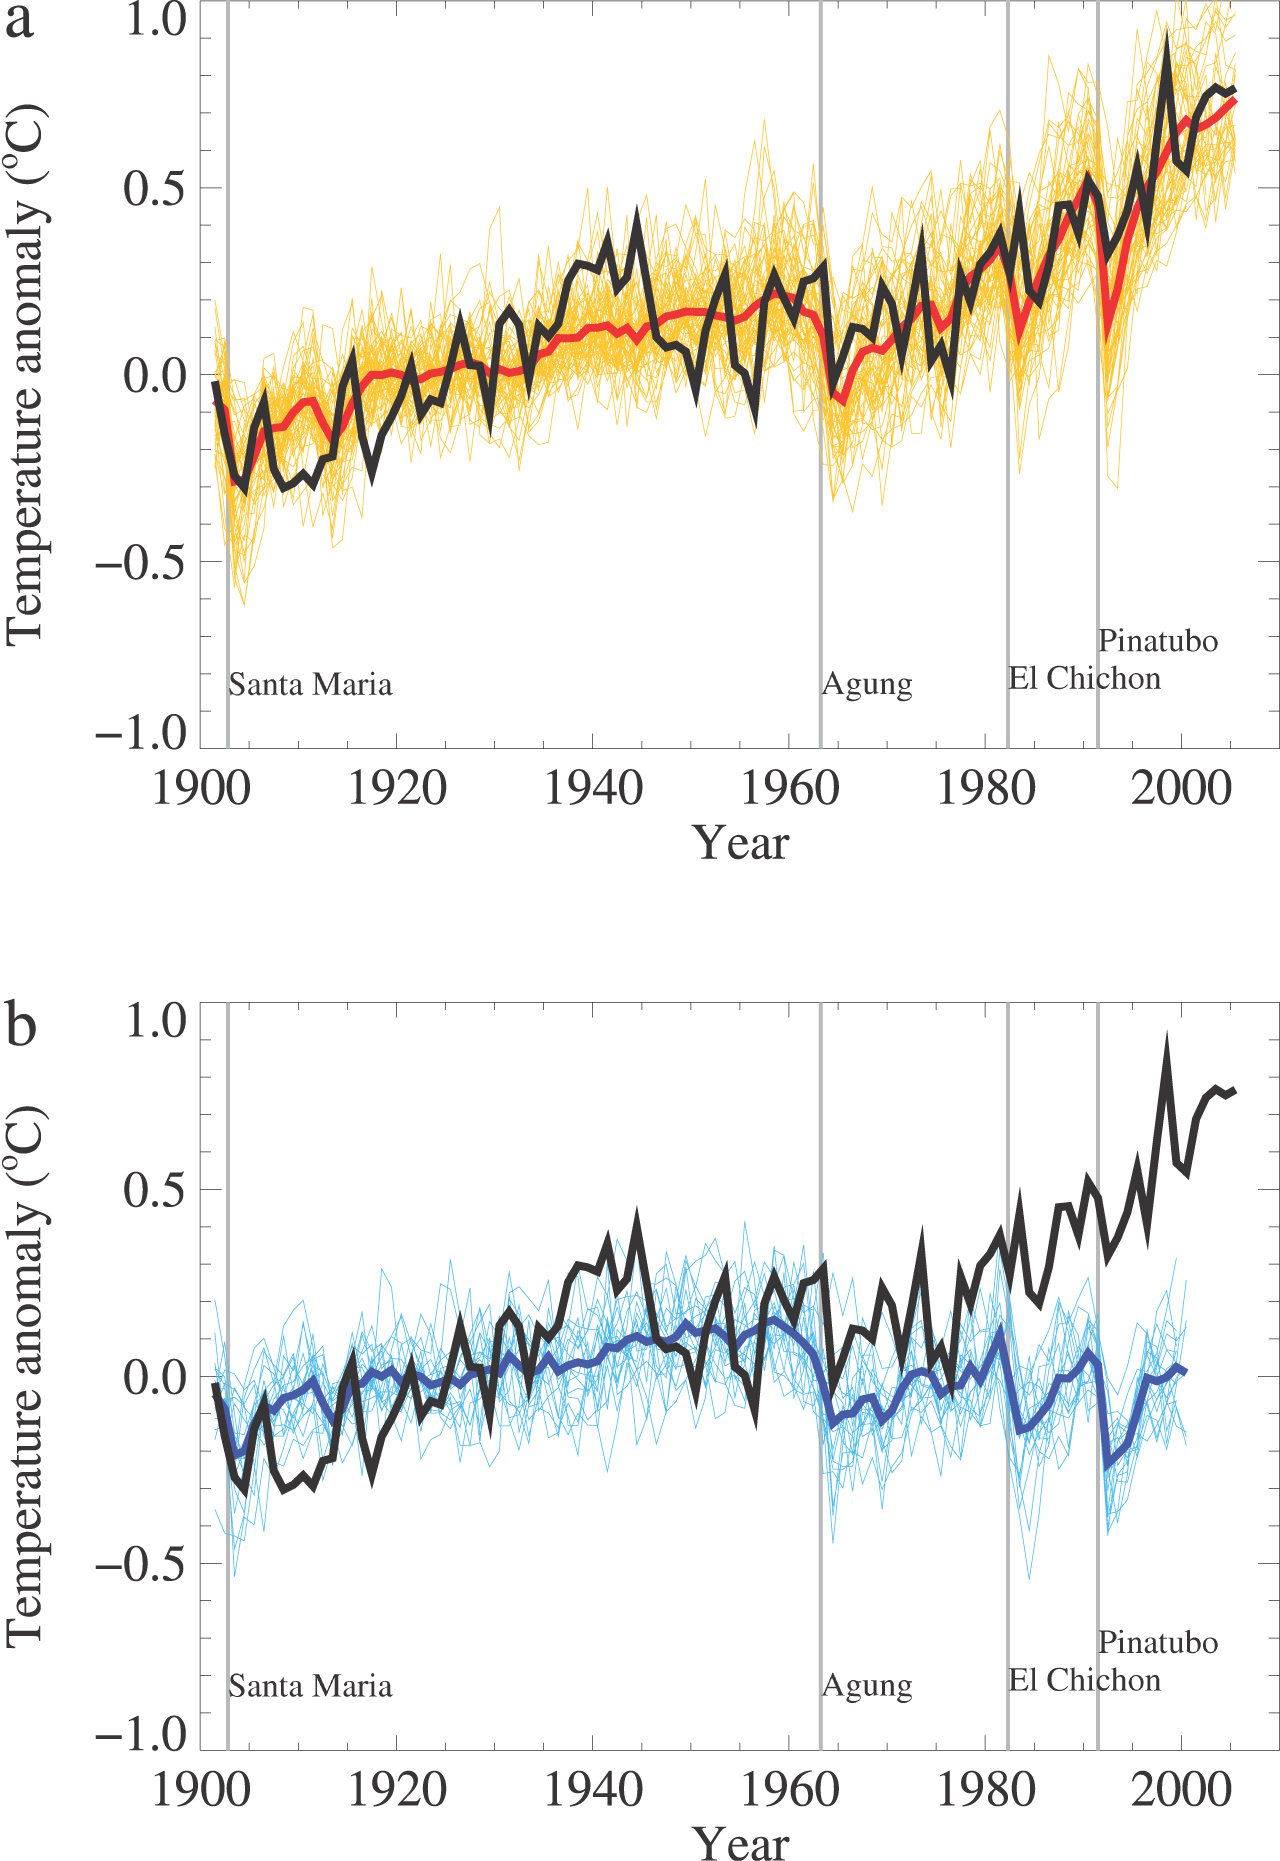 So there are two defences in there: the first is "oh it must have had some effect" which is just squid ink. The second is refs to some papers - this is better. The papers JN is referring to here are Fujii, Y. (2011). The role of atmospheric nuclear explosions on the stagnation of global warming in the mid 20th century. Journal of Atmospheric and Solar-Terrestrial Physics, Volume 73, Issues 5-6, April 2011, Pages 643-652 and Edwards (2012) Entangled histories: Climate science and nuclear weapons research, The Bulletin of Atomic Scientists. The statement that "We provided two papers with estimates in the same ballpark" is rather hard to understand if you read the papers. The Edwards one can be neglected; it says nothing really to the point. The title of the Fujii one is thoroughly to the point, and if we had nothing but the title it would prop up the JN / DE theory wonderfully. But the paper is either ignorant or dishonest, I don't know which, since it says The stagnation in global warming in the mid 20th century has not been simulated well even by the most advanced climate models. But as the graph I've inlined shows (from IPCC AR4 WGI) that's not true (and note that the paper was written well after AR4. But the main problem with the Fujii paper is that it makes no attempt to deal with actual observations of stratospheric aerosol loading. Its full of arm-waving, and it attempts to compare the 440 MT yield with the traditional "nuclear winter" papers; and it even manages to notice that the comparison makes no sense because the nuclear winter scenario is based on soot from city fires being lofted; but goes on to make the comparison anyway.
And so we return to the pic I inlined at the top, and will include again here slightly cut for convenience:
(this stuff is also available somewhat updated and in glorious techicolour from http://data.giss.nasa.gov/modelforce/strataer/).
If you care about the details, you need to be aware that the data here is non uniform, and fairly crude in the early days. As they say:
We divide our discussion of stratospheric aerosol data sources into four periods (Figure 1), which have successively improved data quality. In period 1 (1850-1882) we have only very crude estimates of aerosol optical thickness based on the volume of ejecta from major known volcanoes, supported by qualitative reports of atmospheric optical phenomena. Period 2 (1883-1959) has measurements of solar extinction, but during the time of principal volcanic activity (1883-1915) the data are confined to middle-latitude northern hemisphere observatories. Period 3 (1960-1978) has more widespread measurements of solar and stellar extinction, lunar eclipses, and some in situ sampling of aerosol properties. Period 4 (1979-1990) adds precise widespread data from satellite measurements.
Incidentally, I'm not entirely sure what the "?" above the peak over Pinatubo is; probably its the caveat about post-1990 data at the end of their section 2.
And, errm, well: there you have it. The stratospheric aerosol loading looks like volcanoes, and looks nothing at all like the line DE's model produces. Attempting, in a genuine physical model, to use a bomb-test forcing that peaks at more than 10 times the volcano forcing and whose time-integral is even larger would produce massive cooling. In DE's toy curve-fitting model you can mash the curves together, but it means nothing.
This ties into “Dr” Roy Spencer is sad and lonely and wrong (and part 2, where I diss Curry as well). And by that I mean the overall theme, not the details: that JN / DE don't have anyone serious they can discuss this stuff with, so they're forced to do all their "science" in isolation. Which is, like, really hard maan. Which is why people don't do it if they have a choice.
The premptive framing of the matter by magazine covers emblazoned:
" ARE ATOM TESTS CHANGING THE WEATHER ?"
set the stage for a whole genre of attitudes, factoids ,and films catering to them.
Existential threat inflation is still going strong.
It doesn't matter, Dr. C., Jo's peanut gallery will love it anyway, which is all that matters to her.
It never occurs to types like Jo and the Rocket Scientist that, if a thing like this supposed nuclear testing forcing were a genuinely Big Deal, it would have been bleedin' obvious to climate scientists a long time ago.
They won't give up hope that the Earth is littered with overlooked nuggets of AGW-busting Trooth, just waiting for them to find and plot on colorful graphs.
Charmingly naive, in a civilization-threatening sort of way.
"Which is, like, really hard maan. "- WC
"Existential threat inflation is still going strong." - R
"Charmingly naive, in a civilization-threatening sort of way." - AR
It's so nice to be back in Kansas.
Adam R. - given what DE is doing is akin to mixing metaphors and coming up with something that is not even wrong, I prefer the term:
"Rocket Surgeon".
When you know hardly anything about the underlying physics of a problem you're free to make up whatever you like, and to any desired order of magnitude for its effects. It must be a liberating experience.
The real problem is that they're stuck at step two of their "model."
So this illustrates Betteridge's law of headlines:
en.wikipedia.org/wiki/Betteridge's_law_of_headlines
Russell, even paranoids have enemies.
William, most striking to me is their idea that the dust from bomb testing would be more persistent than the same from volcanoes. The graph makes it obvious that can't be true, but why even think it to begin with? Bomb tests didn't produce much else, unlike volcanic SO2 (from which IIRC their lingering climatic cooling effect largely derives). I don't blame them (maybe just DE) for having the thought, but I do blame them for not figuring out within a few minutes that it's a non-starter but even so having the temerity to "publish" as they have. D-K writ very large indeed.
[There is a bit somewhere - but I can't be bothered to find it - where JN speculates that maybe 'cos the dust is radioactive it might do, like, weird things maan. But again, that's just fitting the obs to the theory -W]
Steve , the nuclear winter meltdown began with a system programmer's admission that the dust parametrization , and hence the optical depth un-doubling tme was "Basically just a guess.
Some true believers at Rutgers may persist in spinning the same set of prayer wheels, and go on dispatching solar powered flying carpets of soot into their stratosphere, but the Apocalyptic original paramretrization did violence to the prudential limits of the Precationary Principle.
Hey guys! I mean, like, I think you're way off base disparaging Jo Nova's blog with "digs" like " Jo's peanut gallery will love it anyway..." I mean, like, Jo's so-called "peanut gallery" is making some of the most important contributions to "climate science" to be found anywhere, now-a-days.
For example, there's this "bloke" (I think that's what they call 'em in Oz), who comments under the "anonymous-coward" pseudonym "mike", who has finally solved what was only yesterday thought, by all thinking-people, to be the salient question in climate science today (see comment no. 9 at Jo Nova's July 5, 2014 "Weekend Unthreaded" post and just marvel at the audacity and brilliance of this "mike"-dude's (no doubt on this one--that's what the Yankee-Doodle-Dandies call 'em) insights).
Oh wait!...This same "mike"-chap (I think that's what the Brits call 'em), from out-of-nowhere, has also produced some further seminal research and and trenchant analysis which he reports in comments to WUWT's June 18, 2014 "Tauntology in the Hinterlands" and July 7, 2014 "Weekly Climate and Energy News Roundup"
Wow! Good stuff!!! I mean, like, c'mon Stoats, chuck your petty prejudices with Jo's blog (and Watts') and check this "mike"-whippersnapper out. I mean, like, he's "nailed", for all time, those issues, surrounding the Deltoid-blog, that have, heretofore, so vexed the many scholars of that improbable site. I mean, like, we're talkin' "S"olid, "S"ettled "S"cience with three capital "S's".
So who is this bad-boy anyway?
Remember, the "winnable nuclear war" assumed targeting military installations, not cities -- and after a couple of weeks, come out of your fallout shelter and resume normal life. They didn't know much about EMP effects until the high altitude tests around the Cuban Missile Crisis, and I recall around that time was when the Duke University forest department tested a cobalt source and discovered the expected radiation from a nuclear war would kill the forests. That's one place that big fires started to be considered.
Then little countries with little war plans got involved:
http://cosmosmagazine.com/features/nuclear-autumn/
That's not a response to the point I was making, Russell.
I'm actually a bit surprised we don't see something - the Antarctic ice cores reveal signatures for Chernobyl and various atomic tests through beta radiation.
Beta radiation from snow (paywalled), Dibb, J., P.A. Mayewski, C. Buck and S. Drummey. 1990. Beta radiation from snow. Nature
Chernobyl nuclear accident revealed from the 7010 m Muztagata ice core record." Tian LiDe et al, Chinese Science Bulletin, May 2007
Snow pits - not ice cores ... aaagh
[I think that's at least in part because big volcanoes are much bigger than you might think, so the aerosol loads are much bigger than you think: We obtained a scale factor to convert Mitchell's stratospheric mass loading (his Figure 3) to an optical depth (0.0025 per million metric tons)... 0.0025 is not a large optical depth; a million metric tons is well over what any bomb will loft -W]
Nuclear bombs are a big deal compared to conventional bombs, but they're peanuts next to a big volcano. Pinatubo put 20 million tons of SO2 *into the stratosphere*, and ejected *10 cubic kilometres* of ash. I mean, seriously. That's ten *billion* cubic metres.
The Godzilla Effect?
> Rutgers
http://onlinelibrary.wiley.com/doi/10.1002/2013EF000205/full
DOI: 10.1002/2013EF000205
Using "an Earth system model including atmospheric chemistry, ocean dynamics, and interactive sea ice and land components" to model "limited, regional nuclear war between India and Pakistan in which each side detonates 50 15 kt weapons"
The early papers about a nuclear exchange, although in hindsight assumptions and calculationswere wrong, came to a reasonable conclusion: "don't do that."
Ya know, I'm glad they didn't. Those fallout shelter plans in the racks at the Post Office were fantasy.
Bombs? Who needs bombs?
http://www.eurekalert.org/pub_releases/2014-07/f-rlo070214.php
----excerpt follows ----
"... these intensities of short-wavelength UV-B radiation (280 – 315 nm) are unprecedented.
"A UV index of 11 is considered extreme .... we measured an index of 43. If you're at a beach in the U.S., you might experience an index of 8 or 9 during the summer, intense enough to warrant protection. You simply do not want to be outside when the index reaches 30 or 40."
The intense radiation coincided with other circumstances that may have increased the UV flux, including ozone depletion by increased aerosols from both seasonal storms and fires in the area. In addition, a large solar flare occurred just two weeks before the highest UV fluxes were registered. Ultraviolet spikes continued to occur – albeit at lower intensity – throughout the period of solar instability, and stopped thereafter. While the evidence linking the solar event to the record-breaking radiation is only circumstantial, particles from such flares are known to affect atmospheric chemistry and may have increased ozone depletion.
"While these events are not directly tied to climate change, they are sentinels of what could occur if ozone thins globally," Cabrol says. "The thinner and more unstable the ozone, the more prone we will be to this kind of event."
High UV-B exposure negatively affects the entire biosphere, not just humans. It damages DNA, affects photosynthesis, and decreases the viability of eggs and larvae. For these reasons, it is important to keep a close watch on UV flux levels.
"While this unsettling record might be the result of a 'perfect storm' of events, it could happen again," says Cabrol, "because the factors that caused it are not rare. What we need is more monitoring of the ozone changes in these areas. These fluxes, which are comparable to those of early Mars, are occurring in a populated area."
It's not that I would expect nuclear tests to be anywhere near as large as volcanic eruptions, I merely expected they might be observable in the data. Though of course many were made in the Pacific and probably just kicked up a lot of water vapor.
[I tried making the point about being over-water to JN; of course it just bounced off. The point about comparison to nuclear-winter scenarios, BTW, is that those assume huge lofting of dust from burning cities; which of course doesn't occur during tests -W]
http://www.sciencedirect.com/science/article/pii/S0012821X02009305
"... we present here the first complete records between 1952 and the present day of northern temperate latitude 240Pu/239Pu and 238U/235U atom ratios for atmospheric deposition. Such information was not derived directly during the period of atmospheric testing because suitable mass spectrometric capability was not available. The currently derived records are based on an annual herbage archive and a core from an Alpine glacier. These studies reveal hitherto unseen fluctuations in the 238U/235U atmospheric fallout record, some of which are directly related to nuclear testing."
Earth and Planetary Science Letters
DOI: 10.1016/S0012-821X(02)00930-5
Volume 203, Issues 3–4, 15 November 2002, Pages 1047–1057
14.
We obtained a scale factor to convert Mitchell's stratospheric mass loading (his Figure 3) to an optical depth (0.0025 per million metric tons)... 0.0025 is not a large optical depth; a million metric tons is well over what any bomb will loft -W]
Which is why the TTAPS baseline and all dust scenario ended up in the factoid cemetary - even at the Cold War's height, the nuclear arsenal's optical depth potential remained in the single digits, ahd thanks to the SALT process, those arsenals shrank by half in the '70's
#16 J Bowers. That's too good!
In 1954 we awakened something (Global Warming).
All those nuclear tests in the Pacific. Not tests. They were trying to kill it.
http://sqcomic.com/2014/07/09/sqcomicD2201407092912.jpg
22
Given the terrifying risks posed by the Mothra's Wing Effect their concern seems understandable.
What *is* the accepted explanation for the sharp drop in the late 40s (actually it seems to be just 1946-7)? I remember some discussion about this being not a real drop but an artefact due to the way sea temps were measured (intakes vs buckets) but don't recall any major revisions to the temp record resulting from that. Or, if the drop was real, was it to do with the aftermath of WW2? It wasn't volcanoes, for example, so what does that leave?
[I slightly lost track of that. I think the accepted explanation used to be just-natural-var, but then the WWII artifact came in, and... well, as I say, I lost track -W]
This is reminiscent of the nonsense seven or eight years ago, when the Ignorati were trying to claim that atmospheric CO2 came from Nukes and Fossil fuels were innocent. Until someone pointed out that the O signatures are different (O13 vs O14, I think), so attribution was possible and it wasn't the nukes. I think Spencer Weart covered this somewhat.
26 Fergus,
You don't even need isotope signatures. We know how much hydrocarbon we burn and therefore how much CO2 (and water) is produced. Where does all that CO2 go if not into the atmosphere (even if it gets absorbed by the oceans and biosphere it still has to get there via the atmosphere).
> WW2 and after
There's also a kink for the same period in CO2 in Law Dome CO2 record:
http://cdiac.ornl.gov/trends/co2/graphics/lawdome.smooth20.gif
I've heard mention of increased coal smoke putting sulfates in the atmosphere reducing warming; I wonder if the same coal smoke would also have boosted ocean plankton growth, the way volcanic dust does? How much iron in coal smoke?
I recall reading about the virtual halt to North Atlantic fishing and whaling during WWII -- an increase in the top ocean predators would have boosted plankton as well, a 'trophic cascade' works both ways.
And I suppose industrial logging may have paused during WWII.
well, well:
"... deposition of soluble iron from combustion contributes 20–100% of the soluble iron deposition over many ocean regions. This implies that more work should be done refining the emissions and deposition of combustion sources of soluble iron globally."
Citation:
Luo, C., N. Mahowald, T. Bond, P. Y. Chuang, P. Artaxo, R. Siefert, Y. Chen, and J. Schauer (2008), Combustion iron
distribution and deposition,
Global Biogeochem. Cycles, 22, GB1012, doi:10.1029/2007GB002964.
http://onlinelibrary.wiley.com/doi/10.1029/2007GB002964/pdf
cited by lots:
http://onlinelibrary.wiley.com/doi/10.1029/2007GB002964/citedby
Looks to me like combustion by civilization is da bomb.
[Trashed -W]
Just thought I'd follow up on the post-WW2 comments. Comparing HADCRUT3 and HADCRUT4, that drop has been reduced by a large amount. I wondered if this is due to SST corrections, and that is the case. http://www.woodfortrees.org/plot/hadcrut3vgl/from:1930/to:1980/mean:12/…
http://www.skepticalscience.com/hadcrut4_a_detailed_look.html