
We call it "weather whiplash." This is not just meteorologists being funny. It is a phenomenon that perhaps has always been with us to some degree, but that has recently become much more common, apparently. If you were under the impression that there is a lot of strange weather going on out there, you may be right, and weather whiplash may be the phenomenon you've noticed. Importantly, there is good reason to believe that weather whiplash is the result of anthropogenic global warming. In other words, it's your fault, so please do pay attention.
Weather patterns tend to move latitudinally across the globe. You'll get a period of no rain or snow for a while punctuated by precipitation, then the precipitation moves on and it is dry again for a while. The typical pattern of dry and precipitation in a given region changes by season, but if you compare one season to the next over several years there is normally a pattern. In some areas it is mostly wet with some dry, other areas mostly dry with some wet, other areas somewhere in between. The same can be said of cold vs. warm air masses.
Here in Minnesota, May and June tend to have repeated intense storm fronts moving through every few days for a few weeks, though the exact timing of when this stormy weather starts and ends, and how long it lasts, varies. Also, the nature of the storms varies, with some years having many tornadoes, some years having mostly straight line winds, etc. Meanwhile, in Minnesota, I get the impression that August is usually relatively dry and cool. Many Minnesotans who have cabins way up north regard August as the first month of fall, that's how cool it is. Where you live there is a pattern, and you've probably noticed it.
Weather whiplash is when this happens: Instead of periods of dry and wet alternating as they normally do, one of those two patterns (dry or wet) gets stuck in place for a period of time. I get the impression that dry periods, when they get stuck, get stuck for many days in a row, while wet periods get stuck for less time. The reason for that may be this: The dry air masses that get stuck are larger because high pressure systems are big and tend to be dry, while wet weather systems are smaller. So, if all the weather got stuck all at once in the northern temperate region, more landscape would be under dry, clear skies and less landscape would be under wet, cloudy skies.
And of course, a gentle fluctuation back and forth between warmer and colder conditions is replaced, under weather whiplash conditions, with long periods of cooler or long periods of warmer weather.
Here's the problem. If the weather is warm-cool-warm-cool over a periods of two weeks, it never gets that warm or cool. But if it is just warm-warm-warm-warm over a period of two weeks, that's a heat wave. The heat builds and it gets warmer and warmer and warmer until it is just plain stinking hot. Or, conversely, if the weather is cool-cool-cool-cool and that happens mid winter, that's a cold snap. Or, like happened this year in Minnesota, it can get cool-cool-cool-cool just at the time we should be having some spring rains, so instead we get spring snows for a month. Residents of the Twin Cities feel the pain of this even now, because the entire construction season (we have two season here, "Winter" and "Construction") was delayed by a month due to weather whiplash, and the Minnesota Department of Public Works and county and local DPW's have been working extra hard at ruining our commute today so that our commute can be better at some unspecified time in the future, right after the pigs start flying.
If the weather patterns sit in one place for a long time and cold or heat or dry or rain builds up ... so you get a cold snap, heat wave, drought, or floods ... then one part of weather whiplash is in effect. Then, the weather shifts and where there was once hot and dry, and thus maybe fires that denude the landscape, you have floods, made worse not only because of the stalled system but also because the fires prepped the grounds for greater runoff, erosion, and land slides. That's the full weather whiplash pattern. Seemingly interminable weather of one kind suddenly replaced by seemingly interminable weather of another, perhaps opposite kind. Snap.
Farmers have to put their crops in late because of a long period of cool and wet conditions. Then the weather clears and everything is nice and dry, so the farmers plant later than ideal, but at least they get to plant. But then the nice and dry conditions are like the proverbial TV in-laws and never seem to want to leave, and good planting conditions turn into a worrying period of not enough rain and that turns into a moderate drought, and that turns into a severe drought. Then, just as you are about to harvest the half dead corn and maybe use it for halloween decorations because it is not good for anything else, the weather whiplashes on you again and your half dead crops are mowed down by a series of hail storms. This is not good for farmers.
Weather whiplash does seem to be a recent phenomenon, even if stalled systems can actually happen at any time. I think this is true because people like Paul Douglas seem to think it is true, people who have been watching the weather every day for years. It is hard to find a simple comprehensive set of data that demonstrates this, however. One way to look at this is to examine the frequency of "natural disasters" of various types over time, according to the people who know most about such things: the insurance industry. Following is a graph just for the US. I assume that weather whiplash is a global Northern Hemisphere phenomenon (maybe also Southern Hemisphere, but for various reasons maybe not; see below). I also assume that while the United States, being fairly large, is thus a good sample of the Northern Hemisphere, weather whiplash might be happening more in Eurasia one year and more in the US another year. However, there is reason to believe that that would not be the case to any large degree because the jet stream waviness is a global thing. Anyway, here's a data set in the form of a chart from the insurance industry showing natural disasters in the US from 1980 to 2011. It is from this document (PDF).
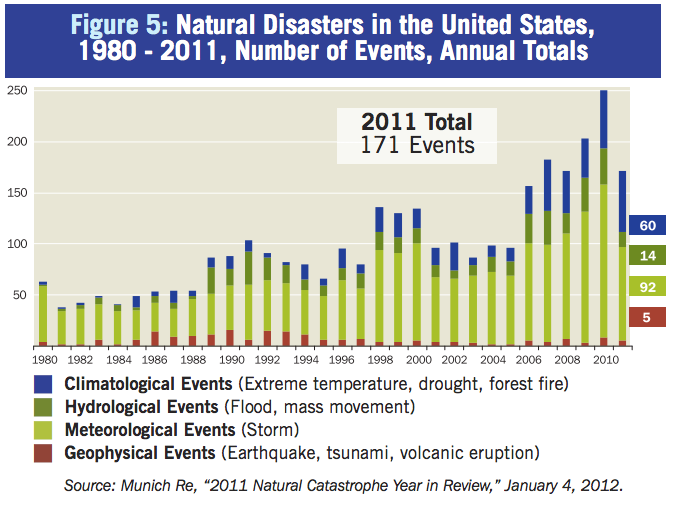
Clearly there is an increase in the overall number of disasters. Climatological events including extreme temperature, drought, and forest fires increase across the time period of consideration. Floods and mass movement of water also clearly increases across this time period. Storms also increase. Geophysical events on the other hand, don't. This is, of course, what we would expect if weather related events were having more of an impact. Is this weather whiplash?
One could argue that global warming would increase extreme temperature conditions and drought without anything special like weather whiplash happening. Also, global warming can increase rain and flood related problems because warmer air and seas means more evaporation. And, certainly, that is what has occurred over time.
And this is a very important point that I keep telling people but I'm not sure how well it has gotten across. Adding heat to the atmosphere may add moisture, and it may add drying conditions as well. It might increase storminess, or the intensity of some storms. But that is just a quantitative change in the weather, caused by global warming, and while important it is still a simple matter of degree.
Weather whiplash is not a quantitative change in weather patterns. It is not just a bit more rain or a bit more heat in what might otherwise be a rainy day or a hot day. Weather whiplash is a qualitative change in the patterns of weather. Qualitative, large scale features of climate (and weather) give us things like desserts and rain forests. They give us seasonal patterns. They give us expectations of a wet spring that gets dry enough to plant, enough rain falling in small enough bouts to keep the crops growing over the summer, and a reasonably dry fall so the harvesting machinery can get out in the fields and bring in the sheaves. Or, if there is a qualitative shift in the climate and weather, like weather whiplash becoming a common phenomenon, it might be that you can't really grow corn where you were thinking you could, or if so, you need a different approach. And since all we eat and grow is corn, we are in big trouble. It might mean that the idea of living in excessively quaint villages next to medium size creeks in very large mountains is simply not an option any more, because "1,000 year floods" can happen any time if weather whiplash happens to aim its cruel cat-o-nine-tails at your quaintness.
The qualitatively distinct phenomenon of weather whiplash ... the multi-day or even multi-week long stalling of weather patterns ... builds on incremental increases in dryness of air (due to heat) and increased wetness of other air (due to increased evaporation) and increased storms (due to increased energy in the atmosphere) and make all that worse.
Imagine you have the habit of tossing the daily accumulation of spare change that forms in your pockets in random locations around your house at the end of each day. Then, something changes in your pattern of behavior and you end up coming home with more change every day (the price of something you frequently buy goes from 95 cents to $1.05, and you only pay with dollar bills). You still toss the change randomly, but now there is somewhat more spare change on your nightstand, on the table by the front door, in that basket on the desk in your study, in the laundry room. That's a quantitative increase in spare change due to a change in the nature of making change during the day. It could matter, you might notice it, it may suddenly become worth it for the teenager in your household to volunteer to help clean the house if they can keep all the change. But it is just a matter of degree.
But what if you ALSO change what you do with the change. Instead of randomly dropping the change in a large number of locations, you change your pattern and most of the time you empty most of the change from most of your pockets into the single basket on your desk in the study. In short order you would have a lot of change in one place not only because you are accumulating more every day but also, and really, mainly, because you are putting it all in one place. Soon there would be many dollars worth of quarters, dimes, nickels and pennies in your basket, enough to take to the bank. Now, THAT's change we can believe in!
Weather whiplash on top of increased moisture in the air brought us drought and fire followed by unprecedented rainfall in Colorado just a couple of weeks ago. It flooded Central Europe and Calgary, Alberta. It brought killer cold and heat waves to Eurasia and North America over the last couple of years. It blocked Hurricane Super-Franken-Storm Sandy and steered it into New York and New Jersey about a year ago. It brought a "Flash Drought" to the US midwest this summer. And so on and so forth.
That, dear reader, is change we better believe in.
OK, but how does weather whiplash happen? I've explained this before (here) but I'll give you a quick run down now in case you are to lazy to click on that link.
There are mysterious processes at work. They are not mysterious to climate scientists who can do calculus, of course, but they are a little hard to explain in a straight forward process without using analogies that ultimately break down. But I'l use a couple of analogies anyway. Feel free to complain about them in the comments, or offer better ones!
First, this: Climate is all about excess heat moving from the equatorial regions to the poles. When it does so across the troposphere, big-giant patterns of air movement are set up. These patterns can be thought of as giant twisting donuts of air encircling the earth (though that is only a rough description, on a simpler planet it would be very accurate). Air at the equator rises, moves away from the equator and cools, then sink, and works its way back towards the equator. Then, the next donut in line does same thing but twisting in a different direction. And so on. In cross section, it looks like this:
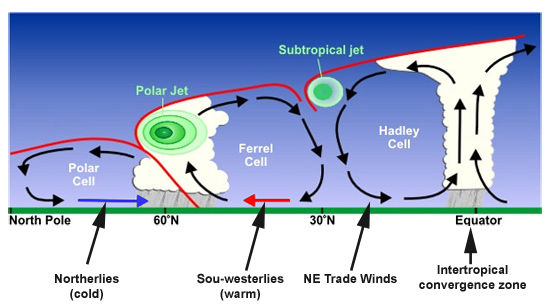
The junctions between these giant twisting donuts, at altitude, are the jet streams.
Weather generally moves along and within these donuts, nudged along and otherwise affected by the jet streams, in the manner described at the beginning of this post. Dry-wet-dry-wet or cool-warm-cool-warm, at the scale of days. Or, should I say, this regular pattern of normal variation happens as long as the jet streams are straight and all normal and stuff.
Here's a depiction of the jet streams being fairly normal (from here):

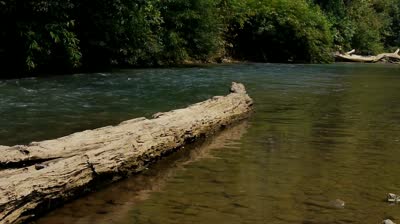
But it does not always work that way. Visualize a straight river with a flat gravel bottom moving along at a reasonable clip in front of you. Observe the hibiscus flowers released by plants upstream (as happens in some tropical rivers) floating by each in a regular linear pattern. The river is a giant twisting donut, the hibiscus flowers are weather events. Now, drop a big log halfway across the river so one end is on the bank, and the other end is out in the middle of the river and pointing slightly upstream. Now, the water is partly trapped, and forms a vortex upstream from the log, and also, a vortex going perhaps in the opposite direction forms downstream from the log. The hibiscus flowers trapped in the vortex now fail to float by, but rather, spin and spin and spin and remain in the same place. Dozens of these flowers might get trapped in place, and beneath the surface, even the gravel is starting to mound up under parts of the stream that are moving slower, and dug out in other parts. Where that vortex occurs, above the log, will be many hibiscus flowers, or, rain storms, over a period of time. Perhaps below the log there will then be a paucity of hibiscus flowers, or, drought, for a period of time. Eventually the log gets lose, rolls downstream a ways, and gets stuck again. Then, some other part of the river ... some other region ... gets to experience the stuck vortex.
When the gradient in heat between the tropics and the poles is at a certain level, you get a nice straight jet stream most of the time. When the gradient drops, for complex reasons involving calculus and such, the whole donut-jet stream thing gets all messed up like the river with the log dropped across it, and the jet streams fold up in to these big curves called "Rossby waves."
Over the recent years, we have experienced general global warming, and this has caused the sea ice that covers much of the Arctic Sea to melt more in the summer than it usually does. This has caused the whole northern region to become warmer because there is less reflective ice and more open ocean to collect sunlight. This has caused even more melting of the ice, and over the last decade we've seen a catastrophic reduction in sumer arctic ice that, while it was expected that this would happen over time, has occurred at a shocking rate of speed that has kinda freaked everybody out. This warming of the Arctic in relation to everywhere else is called "Arctic Amplification." Arctic amplification has caused the differential of equatorial vs. polar temperature to shift, and this has caused the Rossby waves to form.
The waves themselves don't move at all or move only very slowly for several days, and form vortex patterns to their north (which are low pressure systems) and to their south (which are high pressure systems). The air moving along the jet stream itself also slows down. So, any wether pattern that might just float by like a hibiscus flower on a tropical river instead sits here and either rains on you for a week or shines bright sun on you for a week, or whatever. Then, the waves move or disappear and reform elsewhere, like the log getting lose and rolling down stream for a ways, and the place that was for several days dry is now for several days wet.
Wether whiplash.
 Jet stream all messed up.
So, is there any evidence that weather whiplash has been happening more frequently in recent years other than so many meteorologists simply claiming it has?
I asked a number of colleagues who work with climate and weather if there was a readily available database showing jet stream waviness and big storm events that could be converted into a human-understandable picture, or graph, or something, of this change over time. I had already read two recent papers that looked at this phenomenon but they are highly technical and on their own don't have graphics that do the job. So, I asked one of the authors of one of those papers about a quick little trick (OMG HE USED THE WORD TRICK IN RELATION TO CLIMATE) to convert one of their more complicate graphs into something more obvious. Below, I provide you with the original graphic and the one I generated from it. This shows the frequency over time in a limited size study area (not the whole Northern Hemisphere) of conditions under which Rossby waves would cause weather whiplash conditions. Remember, this is just a sample of the planet in both time and space, not the actual number of times this happens. But, the sampling is uniform over several decades, so if there is an increasing trend of jet-stream curviness at the level that could cause wether whiplash, it will be shown, more or less, here. The numbers are so small that I don't even attempt a test of significance. This is provisional. Suggesting. For fun. If one can call the outcome of weather whiplash fun, which you really cant. Anyway, check out these two items:
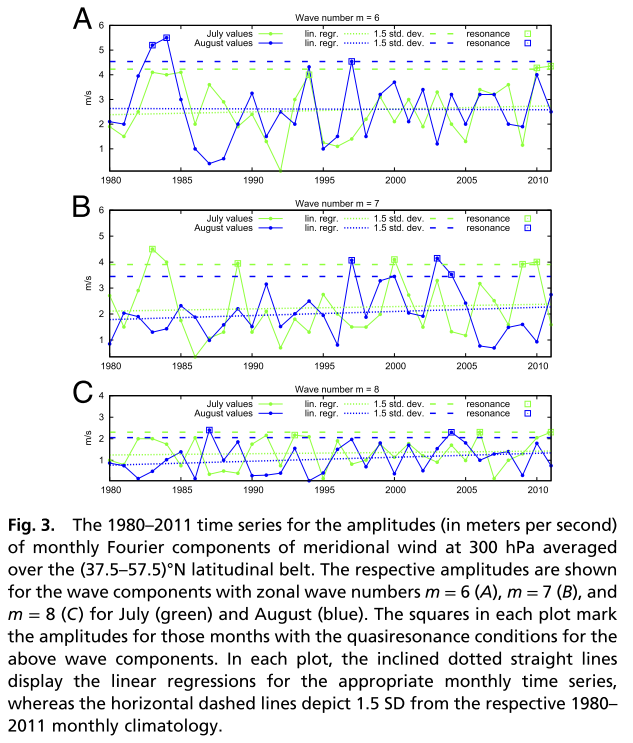
...and, from this figure, I created the following graphic, counting the number of QR events (the squares) per unit time evenly divided across the sampling period:

Here's the thing. We can't easily say that there is a qualitatively new climate system in place, because by definition "climate" is what happens over 30 years of time. There is no "new climate" that is five or ten years old. That, however, is not because of a natural process. It is because of how climate science has evolved. It makes sense for climate scientists to think in multi-decade chunks of time because climate really does vary at levels less than 20 or 30 years time, normally. Taking a normal climate science perspective, we can be pretty sure that "weather warming" is a new climate regime some time around the middle of the 21st century when there is enough data!
But this is a problem. If the situation is changing rapidly enough it will be hard for methods that have evolved in climatology to respond to, or even, really, "see" it. Trying to understand weather whiplash by long term study of the climate system is a bit like using the publicly available long term FBI crime stats that were last updated two years ago to assess whether or not your house is being broken into right now.
As you know, the IPCC report on the scientific evidence related to climate change is coming out just now. That report is not so sure about changes in weather severity or storminess or stuff like weather whiplash. Some weather changes are acknolwedged as very likely, others, the IPCC report is much more equivocal about. However, there are very few people in climate science right now that don't think something like weather whiplash is probably happening, and many are well convinced of it. The problem is that the IPCC reporting process is more like climate than weather in its temporal scale!
The IPCC reporting process has a time lag of several years; the final, most policy related report for this cycle will be out in some 12 months from now, a year after the first report in the cycle, the one with the science in it. In a few years from now, and not likely before, there will be important people sitting in important room in important buildings talking about climate. Someone will say "is drought a thing?" and someone else will say "IPCC says they are only moderately sure at best that drought is a thing." It won't matter that the conversation is happening in July 2015 and the last piece of data in the IPCC report is from 2011 and drought has been a dominant result of weather whiplash for five years ... enough time to overlap with but not influence the IPCC conclusions.
Weather whiplash is almost certainly for real.
Finally, here are two videos that also go into this topic. From the Yale Climate Forum, "New video couples interviews with two experts -- Rutgers' Jennifer Francis and Weather Underground's Jeff Masters -- to explore the 'Why?' of two years of mirror images of weather across North America"
...and ""Wummer." Just days ago, it looked and felt like winter in many cities across the the Midwest. Then whammo, it's summer with record breaking heat across several Midwest states. Yes, double digit snowfalls to triple digit heat all within a matter of days. Meteorologist Paul Douglas says this takes Weather Whiplash to a whole new level."
Very interesting. This (partly) answers a question I have been wondering about. I wonder if it would be possible to get a handle on what is going on by plotting the latitude at which the Northern Polar jet stream crosses a meridian - say, the Greenwich meridian. How far back does jet stream data go? I realise that on some days (if we were going for a daily sample) it would be impossible to say where exactly the jet stream was in relation to that meridian, but those days would just be blanked. I think this would be a valid approach to the question of long term jet stream trends.