
Crandles kindly reminded me that I had three £100 bets with him; they're formalised here (an earlier version at £67 each is here), as:
Crandles offers 3 separate bets on the average of [2012, 2013 and 2014] (to be above/below 4.294, I take the high side), of [2013, 2014 and 2015] (4.119, ditto) and of [2014, 2015 and 2016] (3.94, ditto). In the event of anything that clearly throws things out like a VEI6 volcanic eruption bets are voidable.
Those are NSIDC extent not area. CR kindly reminded me of the 2012 and 13 values as 3.63 and 5.35 respectively. 2014 is pretty clearly going to be higher than 2014, so CR has been good enough to concede early and not wait for the end of 2014. I shall have to think of something amusing to do with the £100. Roll on the next few years for the next two bets in this series.
[Update: I'd forgotten that CR took £100 off me in 2012 (and Neven E50, but we converted that to double-or-quits up to 2015): see Sea ice betting report so I'll just use the £100 to rebuild my tattered finances.]
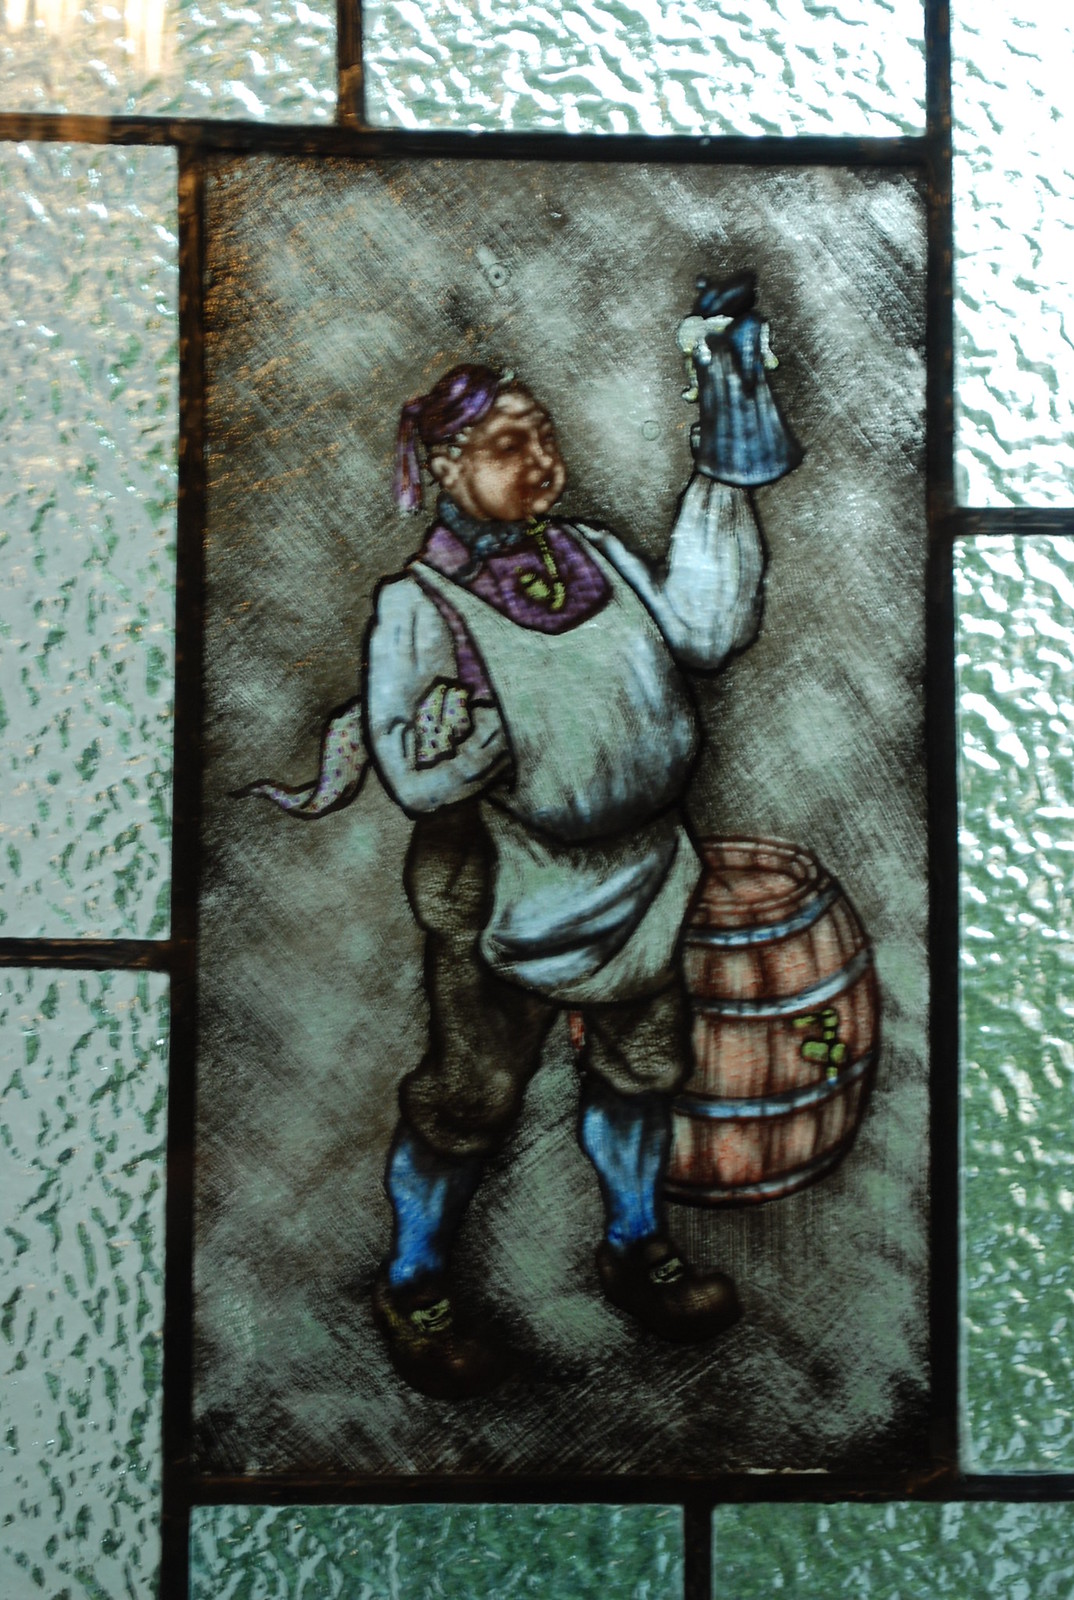
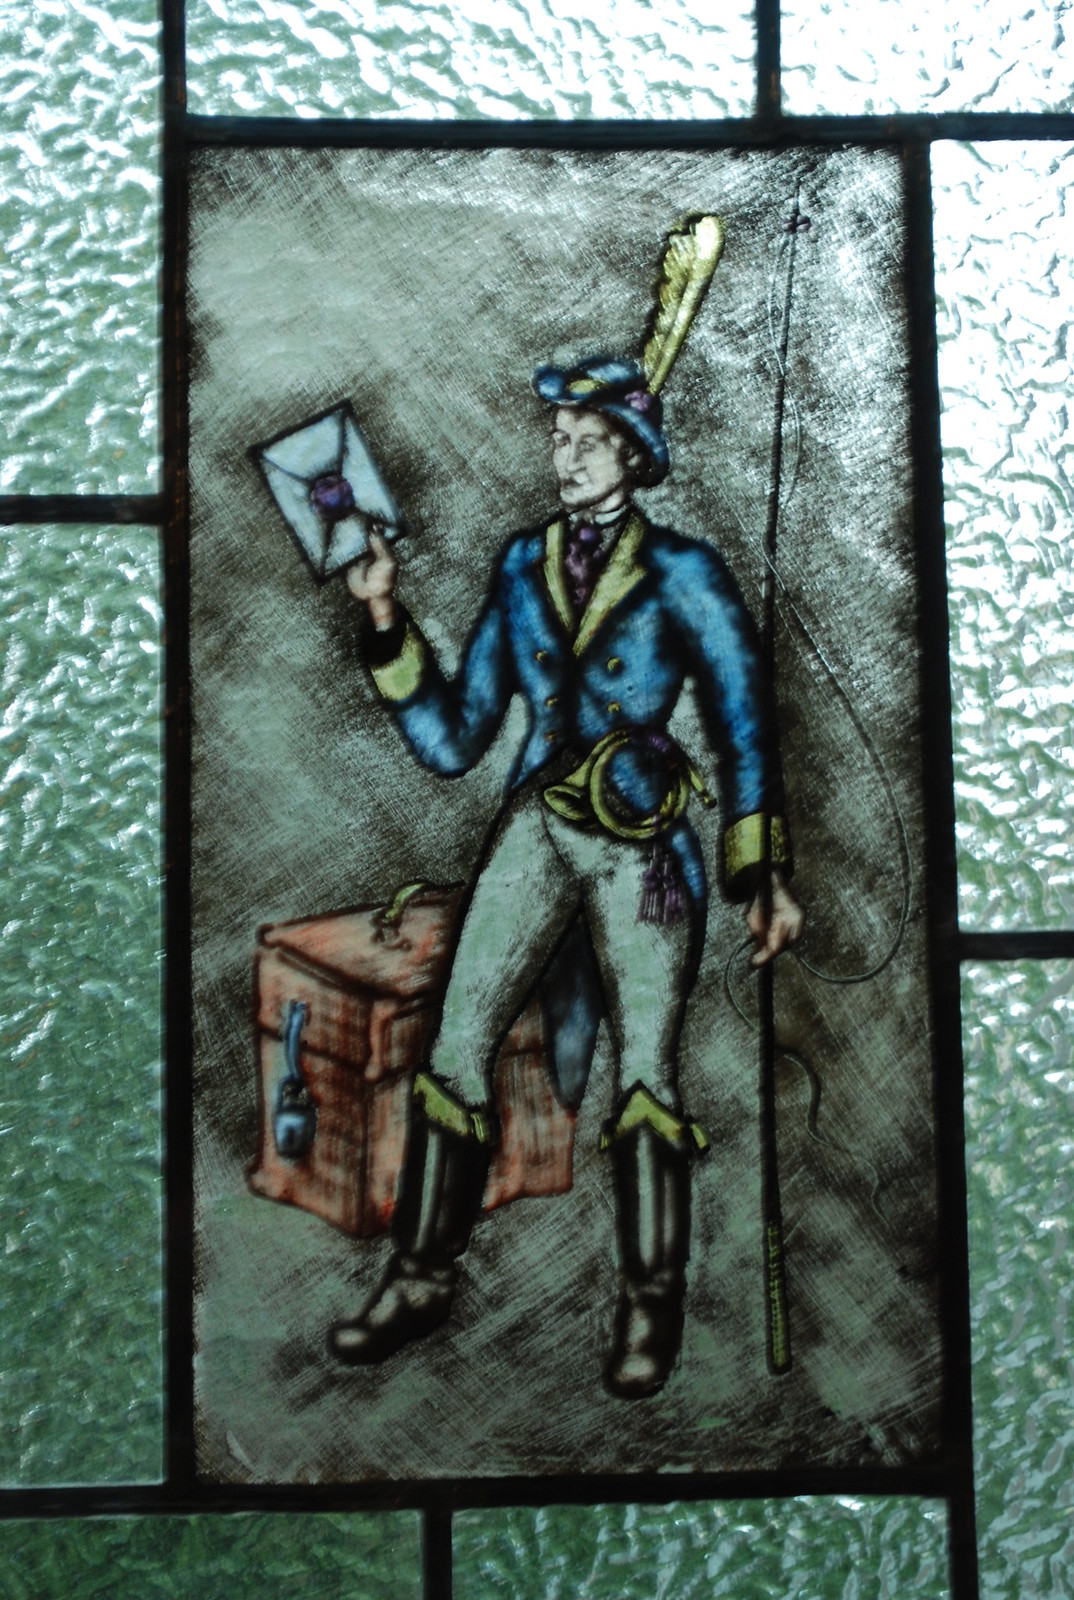
I'll leave you with some stained glass, from the hotel Neue Post in Innsbruck:


Refs
* Probably not betting on sea ice, again - Pierre Gosselin runs away.
2014 is pretty clearly going to be higher than 2014
if that was meant to be
"2014 is pretty clearly going to be higher than 2013"
average 2014 daily data to date 5.17
average 2013 daily data to date 5.186
Not at all clear.
But it is clearly going to be above 3.902 so I clearly lose.
Could the figure on the upper left represent Monckton tertius on his Grand Tour?
And do check out the Alte Post in Lech !
GREENHOUSE SMASHED -
Click here.
No one has a valid counter argument. Keep watching, or try yourself to write a valid rebuttal..
[You can have that one, cos its a link, which I approve of. Don't mistake "no possible rebuttal" for "no one bothered to rebut"; something that could be said of most of JC's posts themselves -W]
Figure on the lower right: JC's little soldier Doug X, here to deliver a dispatch on the progress of metamorphosis.
Those panels are really quite brilliant, particularly the upper left; the local equivalent of a dude at a dude ranch. :-)
Actually it's a postman. Even better!
Has JC officially come out as a denier? The joke and cartoon on that link make it appear so.
I'd forgotten that CR took £100 off me in 2012 (and Neven E50)
If I remember correctly, we played double or nothing with either 2013,2014 or 2015 going below the 2012 record (I believe both for NSIDC SIE and CT SIA, if only one of both the bet is void).
It looks like we'll be even next year. :-)
[Thanks; I'd forgotten that, though its in the same thing I'd already linked to. Noted in the post, now -W]
@ turboblocke
I never know what to make of JCs cartoons. Is this how she sees her colleagues and herself? (see cartoons)
@ D o u g
Is outgoing IR less than incoming? If it is, please explain why. Thanks in advance.
You should buy a new vacuum cleaner to guarantee the high side next year.
There's also the side bet possibility that "low siders" get trapped in the ice and eaten by polar bears. http://www.vancouversun.com/Nanaimo+sailor+stuck+Arctic+polar+bears+com…
http://www.news.com.au/travel/world-travel/why-greenlands-dark-snow-sho…
The most likely is that some combination of increasingly infrequent summer snowstorms, windblown dust, microbial activity, and forest fire soot led to this year’s exceptionally dark ice.
“In 2014 the ice sheet is precisely 5.6 per cent darker, producing an additional absorption of energy equivalent with roughly twice the US annual electricity consumption.”
Perhaps coincidentally, 2014 will also be the year with the highest number of forest fires ever measured in Arctic.
Box ran these numbers exclusively for Slate, and what he found shocked him. Since comprehensive satellite measurements began in 2000, never before have Arctic wildfires been as powerful as this year. In fact, over the last two or three years, Box calculated that Arctic fires have been burning at a rate that’s double that of just a decade ago.
A recent study has found that, as the Arctic warms, forests there are turning to flame at rates unprecedented in the last 10,000 years. This year, those fires produced volumes of smoke and soot that Box says drifted over to Greenland.
Would you expect the initial effect of fires is of haze reducing melt during the summer while the longer term effect is accumulation of soot on Greenland Glaciers? Presumably melting effect on sea ice is rather muted compared to glaciers?
Should "additional absorption of energy equivalent with roughly twice the US annual electricity consumption" be viewed as saying it is trivial?
Does
http://phys.org/news/2014-11-berkeley-lab-scientists-driver-arctic.html
sound like a significant error by models has been found?
[Its certainly interesting. But its probably over-egged; things generally are -W]
> significant error
Uncertainty isn't error, it's opportunity.
That looks like a significant opportunity for improving models toward the observation (arctic amplification)
"The models assume that all surfaces are 100 percent efficient in emitting far-infrared energy.
"That's not the case. The scientists found that open oceans are much less efficient than sea ice when it comes to emitting in the far-infrared region of the spectrum. This means that the Arctic Ocean traps much of the energy in far-infrared radiation, a previously unknown phenomenon that is likely contributing to the warming of the polar climate.
Their research appears this week in the online early edition of the Proceedings of the National Academy of Sciences."
http://phys.org/news/2014-11-berkeley-lab-scientists-driver-arctic.html
referring to
http://www.pnas.org/content/early/2014/10/29/1413640111.full.pdf
PS for someone above -- incoming infrared is a small part of the energy coming our way from the Sun, which is brightest in the green range (ask any plant to explain that).
Earth is brightest in the infrared.
PPS, speaking of the Solar spectrum -- Eureka!
http://www2.lbl.gov/Science-Articles/Archive/MSD-full-spectrum-solar-ce…
http://www.globalwarmingart.com/images/7/7c/Atmospheric_Transmission.png
show there is substantial earth emissions in the 15-30 micrometer range. That seems surprisingly close to the atmospheric window which I would have thought would have been well studied.
Ocean emissivity gets down to 0.85 in this range per fig 3 of the paper linked above.
2K sounds a lot but I assume they have just switched on the effect. In reality the effect is always there not switched on when we discover it. In modelling it takes hundreds of years to get the ocean in balance with new atmosphere. So perhaps 2K in first 25 years isn't that surprising. What is more important is what happens when ocean has been fully spun up to be in balance with the atmosphere and then is forced with our ff burning experiment. Will the modelled Arctic then respond differently? Will it be less reluctant to plunge to seasonally ice free or will there just be less ice in the model to start but still be reluctant to make such plunges?
Any thoughts?
[And if I were dumping this into a model I'd ramp it up to the limit of what could be possible, just to get something you could see in the model. The real effect, if it pans out, could be much smaller. Plus as you say there could be spin-up effects -W]
I stumbled across a somewhat similar 2014 paper refiguring the Antarctic's emissivity -- similar issue, plus high altitude and dry atmosphere so perhaps even more transparent to the far-IR.
DOI: 10.1002/2014GL061216
Noted, the Arctic changes from sea ice to open water, the Antarctic -- would the ozone hole have made any change in this band?
Point for good title:
____________________________
The Atmosphere and How to Avoid it
A Lawrence - Astronomical Measurement, 2014
. ... The air above Antarctica is particularly dry, making a very good if expensive place to undertake IR and submm astronomy....
Far-IR heat loss to space would appear to be considerable: I gather there's a large polar seasonal cycle and also a smaller 11-year solar cycle in upper atmosphere humidity? Ugh, 'oogle image search finds mostly septics.
Well, there's some background from 2005:
D.P. Kratz et al. / Journal of Quantitative Spectroscopy & Radiative Transfer 90 (2005) 323–341
http://ruby.fgcu.edu/courses/twimberley/EnviroPhilo/Far.pdf
"the inter-comparison of six distinct line-by-line models.... have demonstrated remarkably good agreement among the models, with differences being of order 0.5%, thereby providing a high measure of conKdence in our ability to accurately compute spectral radiances in the far-infrared.
...
"The far-infrared, specifed here to cover the spectral range with wave-numbers less than 650 cm−1, is dominated by the pure rotation band of water vapor, and has been shown to account for over 40% of the energy emitted to space by the Earth’s atmosphere-surface system for clear-sky conditions [1]. Recent studies [2–5] have emphasized the crucial contribution that the pure rotation band of water vapor has upon the transfer of far-infrared radiation through the Earth’s atmosphere. Most notably, far-infrared water vapor emission has been shown to have a prominent role in determining cooling rates throughout the free troposphere [2]. Moreover, the sensitivity of the outgoing longwave radiation (wave-numbers less than 3000 cm−1) to perturbations in upper tropospheric humidity has been found to be greatest in the far-infrared [6].
http://www.meted.ucar.edu/tropical/textbook_2nd_edition/media/graphics/…