There has been lots of discussion of this year's arctic sea ice extent. Last year was a shocking 23% lower record breaker. That's 23% lower than the previous record, for which one had to go all the way back to....2005! That's not 23% below the 1979-2001 average, but 23% below the lowest previous measurement! 2005, aside from being the previous record, was also remarkable for being the fourth consecutive year that fell below the trend line. (With a steady decline in noisy data one would expect equal probablities of data points falling above the trend line as below.)
Here is a graph made at that time (2005). 2007's record breaking minmum falls well off that chart, where 4 would have been on the x-axis if it had gone that low:

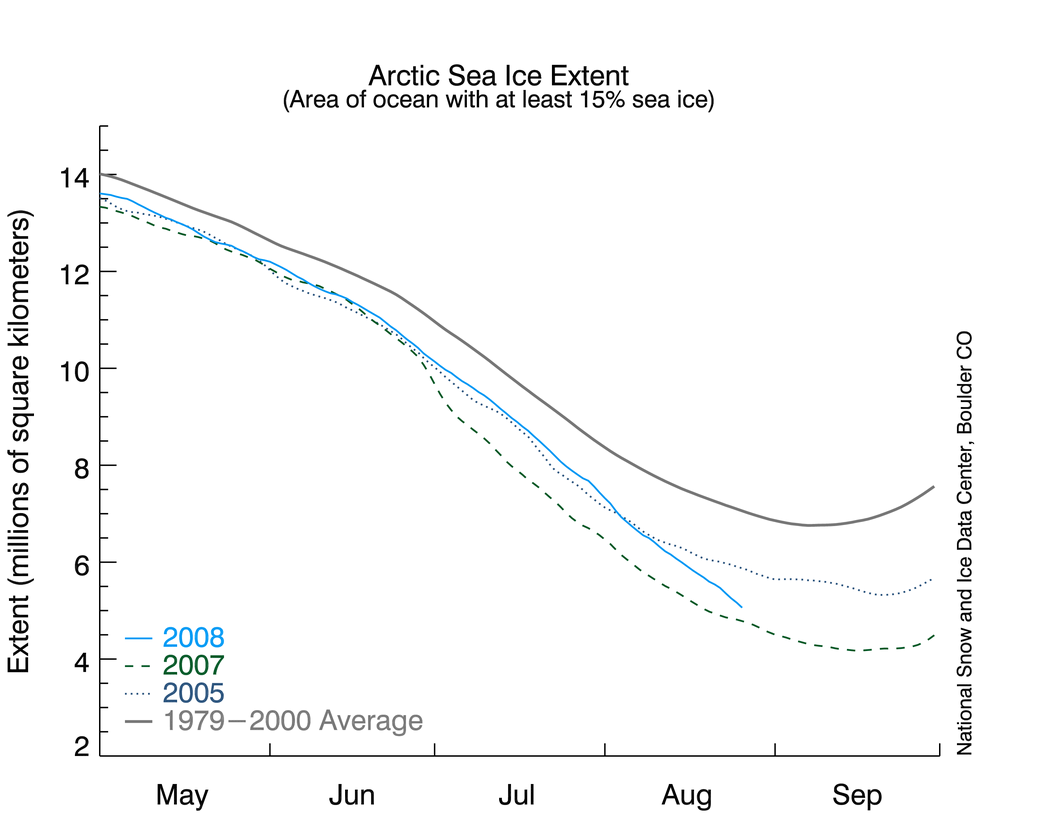
So, as the discussions discuss, here comes 2008, hot on 2007's smokey trail...

Image from the NSIDC
So close! But we are down to the last two or three weeks of melting now, I'd say 2007 will squeak by.
William Connolley long ago took the boringly scientific position that it was pretty unlikely that such a dramatic record as 2007's would be broken anytime soon, much less the very next year and has made a game of betting on it. I dare say it is a much closer call than he ever expected!
But like certain other horse races, the outcome is pretty irrelevant to the long term and substantive issues**. We do not need a new record this very year to still gasp at the rapidity of ice loss, something that not even those eco-alarmist-nazis at Greenpeace were moaning about in 2001. The ice is melting. Fast. The pretty pictures paint a not so pretty picture of a rapidly changing planet. The loss of a summer arctic ice cap also heralds the arrival of a new and potentially dramatic feedback in the form of lowering earth's albedo. Darker sea water will absorb alot of solar radiation that white ice would have shot straight back into space. Not good news for the local permafrost.
So what was the point of this post again...oh yeah "The other arctic sea ice loss", that's what I called it. All of the above graphing and betting is about ice extent, that is to say it is about the area of ocean surface that is at least 15% covered by ice. But there are different kinds of ice, specifically there is new ice and multi-year ice. The graphic below is a pretty kewl illustration of what is happening to multi-year ice. I know you looked at it already, but now I will explain it a bit.

This is a composite of week by week ice thickness maps from 1981 to 2007, you can see the week count and year count in the bottom left of the image. Watch the whole thing to see the exent to which the ice is becoming younger. Five+ year ice (red) is just a shadow of what it was in the 1980's by 2007.
Old ice is thicker, it has had multiple seasons to grow. First year ice is thinner and more vulnerable to melting. In fact, on average the sea ice there has thinned by half as of 2007. That's thinned by half since 2001, not 1981! In 2001, ice on average was about 4 metres thick, it was down to 2 metres in 2008.
Now, I don't know about no book lernin' and no compooter models, but I do know about snow melting on the front lawn and ice unfreezing on the local pond-slash-skating rink, and this vast body of knowledge tells me that, new record in 2008 or not, it won't be long now till the record low extent is 0.
That will be a record that may well go back to the Eemian, though it is hard to know for sure. But regardless, we most certainly do live in interesting times.
** talk to me later if Obama wins and does even one of the following: meaningfully reduce the military budget, establish universal health care, withdraw from Iraq, balance the budget, abolish Guantanamo and other "black sites", take nuclear warfare "off the table", restore FISA law.
Couple of questions.
1. What about the other end of the earth? The artic regions cover both the north and south poles.
If they are not behaving the same way how can you draw any conclusion from just one end.
2. We know that over the same period that global temperatures have dropped from the peak in 1998.
Given the drop of global temperatures what can we conclude about ice levels and temperatures world wide?
It looks like less ice in the arctic means lower global temperatures.
Hi Nick,
Sorry, I still think only of the north when I say arctic though you are quite correct that it technically means poth polar regions.
1. What about the other end of the earth?
The sea ice in the antarctic is on the whole trending very little. Please see this sceptic guide article for a discussion of this issue. The short answer is that the globe is not symetric in some crucial aspects that influence climate and in fact global climate models do not expect warming to be pronounced at the south pole at this time. The reasons have to do with global distribution of land mass (most land is in the NH) and the circum-polar current in the Soutern ocean inhibiting heat transfer.
2. We know that over the same period that global temperatures have dropped from the peak in 1998
This is only true in the most meaningless sense of the data. Natural variation, even of globally and seasonally average temperatures, is very large compared to the multi-decadal trend so you can not assess a climate change with 10 years of data. Chosing 1998 as a reference point is also an egregious cherry pick. Please refer to this article for an expansion of those points.
Your last sentence is an excellent example of how badly we can go wrong by assuming correlation equals causation (not that there even is a correlation in this case).
Thanks for your questions!
Um...Nick....I don't think the facts are what you think they are.
1. It's called the Antarctic. I wouldn't expect them to behave the same way since they have very different underpinnings and surroundings. The Arctic is ocean surrounded by land and the Antarctic is the opposite. IIRC, all the various models show accelerated warming in the north compared to the south.
2. How instant do you expect the effects of warming to be? Even though 1998 was an anomalous peak and temperatures since have been below or the same, this last decade (1998-2008) has been warmer than the previous one and that decade was warmer than the one before.
Kind of a petty complaint, but the colors they chose for the animation are awful. I think most of us are primed to interpret "blue" as "water" when looking at a map, and "2" and "O" are almost identical looking as they flash past. The animation makes it look as though there is ice forming around the edges and growing inward every year...
(Would love to see it re-done with "blue=no ice" and the scale of ice done in increasingly light shades of grey (5-year=white)...)
[I can't disagree with you there - coby]
Intersting about the Eemian, Climatologists often talk about tipping points, but the Eemian was significantly warmer than today and no tipping. In fact the ice ages eventually returned. Is tipping talk alarmist?
Hi dave,
Real Climate has a good post about the use of the term "tipping point" in climate discussion.
WRT the Eemian, I think you are looking at it backwards, we are worrying about thing that *cause* temperature changes, the Eemian is an example of a time when temperatures were higher for some other cause. In this particular case as near as we seem to know is that small changes in orbital cycles cause ice sheet melting which cause greenhouse gas rising which together tipped the climate out of a glacial state. The *result* was the Eemian.
The most crucial difference between then and now is that CO2 levels never rose above ~300ppm, ranging from 180 (deep glaciation) to 300 (no Greenland ice sheet, no arctic sea ice) and today they are 383ppm. It will take deacade of CO2 stability before the full effects are realized.
One thing I was thinking of is that in the Eemian dispite the higher temperatures the Siberian peat bogs didn't release their methane. This is puzzling as it is supposed to be happening now.
dave, on what basis do you believe Siberian peat bogs didn't release their methane?
According to what I hear the melting of the Siberian peat bogs would release so much methane they would send the planet in to superheated meltdown. Since that didn't happen I could only assume the peat bogs stayed intact.