
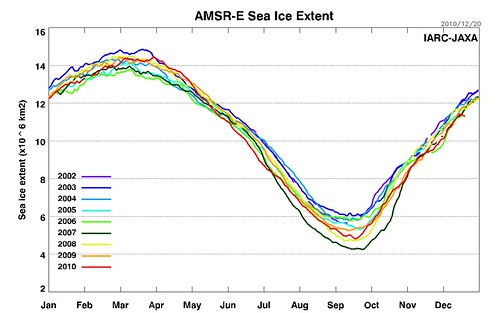
Since we're having this cold spell in the UK (which is just weather, and should not be mistaken for climate, much less global climate) now is perhaps a good time to look at the NH sea ice, which is at a record low for the time of year:
At the moment it is only low by a tiddly bit, and could well start to recover again. But it is also notable that it has been on the low edge of the pack all the time since the end of summer. It certainly bears watching [Thanks to C]. Roll on next years bets...
[Update:
When I wrote this, I should have mentioned No 'Tipping Point' for Sea Ice in Polar Bears' Future (thanks PH) which is a useful antidote to the overhyped killer tipping points of no return stuff. So whilst On the emergence of an Arctic amplification signal in terrestrial Arctic snow extent - Ghatak et al. (2010)(thanks H) is perfectly valid (and expected), the two are compatible, as I hope is obvious -W]
Refs
* RC: Cold winter in a world of warming?
* Temperatures
* No 'Tipping Point' for Sea Ice in Polar Bears' Future
A lot of transport, it seems:
http://www7320.nrlssc.navy.mil/pips2/idis.html
So could well be related to the European cold spell, with the pressure patterns being the culprit:
http://www.wetterzentrale.de/pics/Rhavn001.gif
What's causing the pressure patterns, aye there's the rub. ;)
I've been watching this and wondering whether it is an error of some sort.
http://ocean.dmi.dk/arctic/meant80n.uk.php shows temperatures to have been a bit above average there.
[A bit. But substantially cooler than 2007, 8 or 9. Nice link though - thanks -W]
As was Nick, I was wondering if it was an error, but now it is showing up in the NSIDC Arctic News site too, so I think it is likely real (especially combined with the crazy-high Arctic temperatures that are helping drive the quite-low eastern US and western Europe temps)
-M
"low by a tiddly bit"
Well it looks like lower by nearly half the range of 2002-2009 for this time of year but maybe that still only ranks as 'tiddly'.
Since you say "Roll on next years bets", perhap I should mention the intrade price range for MIN.ARCTIC.ICE:2011>2007 has narrowed down to 30 to 45. As as you cannot look, there hasn't been much trade recently only 5 $10 contracts at 30. Still substantial sized book orders:
Bid
Qty Price
110 30.0
1113 29.0
574 28.0
100 27.0
98 22.0
47 21.0
30 20.0
Offer
Price Qty
45.0 10
50.0 100
75.0 578
The fee structure is changing instead of transaction and expiry fees there is now a US$4.99 fee per month which is better if you are active but worse if you just want a few contracts just to add a little bit of interest to watching the sea ice. Maybe I should offer to undertake transactions for such people?
So let's see:
Is the pea under the NH sea-ice shell?
Under the Russian 2010 heat-wave shell, ala Real Climate?
I'm going to guess that it is going to take a long time for this La Nina to work its way through the system, and that's where we'll find the pea for the next several years. The oceans seem to be "turning"? I think all the Arctic blocking is possibly unrelated and not well understood, no? Enjoy, and happy new year.
Oh, and I hate to be the guy perpetually dropping the "hey, look at me and my ability to bookmark the 30-day map" but isn't Russia facing something phenomenal here as well (c.f. summer heat wave)?
http://www.esrl.noaa.gov/psd/map/images/rnl/sfctmpmer_30a.rnl.html
Your post came up in my RSS reader right next to this one showing that Antarctic ice is at a record high. Helps to know both facts. http://wattsupwiththat.com/2010/12/21/sea-ice-news-32-southern-comfort/
[I wouldn't trust Watt as far as I can throw him. In particular, "there hasnât been much happening on the way to peak Arctic Ice this year" is an obvious lie; I hope you spotted it yourself -W]
http://rt.com/news/prime-time/coldest-winter-emergency-measures/
forecast from October, polish scientists wizards (I know the Ice Age garbage has been batted around already, but still)? We should all be careful here. Glad Rasmus is sure that winters must have been "really frosty" in his foggy youth. Anecdotes anyone? Grandma said the 30's were real "scorchers". . .and my Inuit great-grandpa says that the winds have caused the change in the arctic ice.
[Tut tut, you should read your RC: that one is twaddle -W]
Anyone read "the Overcoat" by Gogol lately? (the last page may be the greates in all literature, IMO).
thine, AIUI the Arctic dipole anomaly doesn't add heat (or cold) overall, rather it redistributes things. What's important about it is that it wasn't observed before ~2000, which coincidentally is when the Arctic sea ice began to crash. The big question of practical interest does seem to be these blocking events, and they are getting lots of scientific attention, but the problem is that it's hard to draw conclusions from such a short record (other than to point out how unusual a given event is relative to the historical record). There is a general expectation that as warming proceeds there will be more blocking events as the equator to pole temperature gradient flattens; the latter is not a matter of speculation since it's what happened in past warm climates, e.g. the mid-Pliocene. Predicting the future course of this stuff seems to be problematic, especially since the models failed to predict the ADA, although Trenberth at least seems confident that it will not only persist but get worse.
My own speculation is that the northern jet can't remain stable when it gets squeezed too far to the north, but that's not much of an insight.
I'm confident that when Rasmus speaks of colder winters in his youth it's not an anecdote, thine, but rather a matter of record. Scientists seem to prefer data over anecdotes.
WC - i have read it (as you notice I say Ice Age "garbage"), but still predictive for Russian winter no? Suppose we'll listen for the wire . .
[I was responding to your "but still" bit. I think it is still junk, even if this winter is cold. Which of course we don't know yet. As I understand it that stuff was gulf stream slow-down. Todays theory-du-jour is reduced sea ice extent, though it is rather preliminary -W]
Steve Bloom - very sound response, thank you. If the changes were underway a decade ago (?) do you think such changes have taken place recently before (i.e. prior to 1979 recordkeeping).
Thanks, I will keep that in mind about scientists, perhaps I'll meet one someday!
Good question, thine. Based on some unfortunately pretty fragmentary records, parts of the Arctic do seem to have been warmish during the 1930s. The fragmentariness makes it hard to tell quite what was going on, but the general point can be made that even if there was no anthropogenic causation (not clear, and maybe never will be, although IIRC some research [paper by Flanner from a few years ago if memory serves} has pointed to early industrial black carbon production as a possible cause) the climate does have a degree of internal variability. AIUI, though, there are enough records to establish that the entirely anthropogenic expansion of the tropics wasn't behind it, unlike in the present. Warming really does have to be global to move the entire atmospheric circulation to such a degree.
Re the Antarctic sea ice, it was recently pointed out here that Manabe predicted the observed slight overall increase (but note the regional distribution!) in the '80s. Along with the similarly-predicted glacial lag of CO2 to temperature increase, both of these modeling successes have ironically become denialist hobbyhorses (along with today's weather whenever it cooperates).
Predictive for the Russian winter? Has it even been established that the cold anomaly you pointed to is unusual, to say nothing of indicative of a trend? First things first.
"has it ever been established . . .?" i imagine it will be soon.
re comment 10 - The arctic sea-ice shift change approx 2000? How about 1979 being the start of the shift (as well as new instrumentation): http://www.grida.no/publications/other/ipcc_tar/?src=/climate/ipcc_tar/…
fig 2.14
seems to correspond well with:
http://cses.washington.edu/cig/pnwc/aboutpdo.shtml
fig 2
I see trouble with claiming otherwise (including this latest "theory-du-jour"). And i find the statement "warming really does have to be global to move the entire atmospheric circulation to such a degree" to be speculative with our limited tools.
Unfortunatelt, this in itself is about as meaningful as the maximum in sea ice that occured in spring 2010. Pointing out one data point plays right into the hands of the denialists. It is too easy to play tit for tat.
[Err, no. Assuming you mean the JAXA series, there was a max in spring but (a) much less of an outlier and (b) only a max on the AMSRE series. So max, you have to include the SSMI/R series too. Which Spring '10 certainly wasn't a max. For *min* you're on far safer ground with AMSRE -W]
"Since you say "Roll on next years bets", perhap I should mention the intrade price range for MIN.ARCTIC.ICE:2011>2007... "
I'm somewhat saddened that the suggestion that there ought to be multiple contracts covering a range of minimum extents seems to have fallen on deaf ears. It would be nice to see whether anyone out there actually believes there's going to be a substantial recovery enough to risk money on it at any odds not massively in their favour, which is a bit hard to do when the only available bet is on whether a new record low will be set or not.
Re "Err no to BKsea"
2001 if not 2003 were higher for area per http://arctic.atmos.uiuc.edu/cryosphere/IMAGES/sea.ice.anomaly.timeseri…
But even if you think you will win the tit for tat (eg Julian's link being trounced by
http://tamino.wordpress.com/2010/12/21/its-the-trend-stupid-2/#more-3237 )
Some people won't really read in full and go away with impression 'they are still arguing over it'. So despite being trounced by the arguments, it creates the impression of the arguments being less one sided than they actually are.
So I think BKsea and Tamino have a point.
Does this mean that I should have restrained myself from asking if you thought the current graph more interesting?
Maybe but I am more inclined to the view that we should carry on regardless of potential for denier (underhand?)tactics. Certainly the scientist should carry on regardless.
Re #14: The ignorance, it overweens. Try reading the literature on the expansion of the tropics and its consequences. This review is a good start.
Oh, jeez, the PDO. That's really quite dull. Teleconnections, real and not so real, are everywhere to be seen, but (to paraphrase a famous physicist), establishing causation is tricky, especially of the climate. Some simple physical reasoning will tell you that the North Pacific is a poor place to look for a key climate driver (and hey, I could see your PDO driver and raise you e.g. increasing drought in the western U.S. as driving it in turn -- see how this goes?). Re the Arctic sea ice, note the sharpish step change ~2000.
Re the Russian cold spot, I said "even," not "ever." In any case, why soon? Its unusualness (or lack thereof) can be established right now based on data freely available on the 'toobs. If it persists it may become a different story, but did you check to see if it's still happening as of the last few days, or indeed if it's pattern over the period of that graph even looks like a blocking event? Research awaits you!
It's true if you remember that Watts has two categories:
1) Stuff he can strut, bluff and bluster about
2) Nothing
Steve Bloom,
You might want to read Bingyi Wu et al 2006, "Dipole Anomaly in the Winter Arctic Atmosphere and Its Association with Sea Ice Motion." Journal of climate, 15/1/06.
They find a dipole anomaly that looks very much like Zhang's Arctic Rapid Change Pattern, now named the Arctic Dipole anomaly.
Wu's dipole is found by analysing slp for the period 1960 to 2002, it's the 2nd EOF and accounts for 13% of variability. They note explicitly that this is not the Barents Oscilation.
Steve, why do you think the North Pacific is a poor place to look for a climate driver?
Thanks, CR, I'll have a look.
MH, it is neither in the tropics (in contrast to the Indo-Pacific warm pool that provides the energy for ENSO) nor is there a large flow of heat between the tropics and the Arctic (due to the constraining Bering Strait).
The scientists who study the PDO seem to think it's more or less driven by ENSO. Efforts to find significant PDO effects on climate in western North America have turned up little; IIRC the only possible effect found was on precipitation in the PNW, which shouldn't be a huge surprise since the PDO is defined as a (slight) change in ocean surface temps driving climate in the area the PNW storm track passes over.
Re that "slight," bear in mind that the PDO is detrended, which is to say it's a measure of the degree to which NP ocean surface temps are out of synch with the global signal. It would be of no interest whatsoever, and likely wouldn't even have been identified, were it not for the fact that fish in the NE Pacific are quite sensitive to surface temps.
NP - less energy available to act as a driver
http://www.agu.org/pubs/crossref/2010/2010JD014007.shtml
hat tip to: http://agwobserver.wordpress.com/2010/12/20/new-research-from-last-week…
"On the emergence of an Arctic amplification signal in terrestrial Arctic snow extent â Ghatak et al. (2010) âThe impact of declining sea ice in amplifying surface air temperatures (SAT) over the Arctic Ocean is readily visible, and this âArctic amplificationâ will become more pronounced as more sea ice is lost in the coming decades. ..."
The Bunny devours my words, leaving only a terse pellet.
Thanks, Hank.
The excursion continues. It seems that numbers like this are unprecedented for this time of year. http://arctic.atmos.uiuc.edu/cryosphere/IMAGES/sea.ice.anomaly.timeseri…
[For the time of year, maybe, but overall, not very: http://arctic.atmos.uiuc.edu/cryosphere/IMAGES/seaice.anomaly.arctic.png From my favourite, JAXA, it looks like a step-down (perhaps an ice advection event, as others have suggested) but now we're on a lower level. At the moment this is just weather; how it goes over the max in March will be interesting -W]
Dumb question, from a non-Arctic/cryosphere guy: Eyeballing the graph it looks like spread is largest near the time of max and min and consistently smaller in the middle of the growth/melting phases. Are the underlying numbers consistent with this (eyeballing a graph is not the most rigorous quantitative methodology) and if so, is there a physical reason?
[Ah, Leon, welcome. I think there is a natural tendency for it to look like that on graphs, because your eye naturally measures the spread perpendicular to the lines rather than vertically. So the spread at the start of July is nearly 1 unit, which is more than the spread at max I think (again, by eye). The thing to do would be to plot the anomalies from the average, but I don't have the tools for that to hand right now -W]
Since we're scrying in the entrails of these charts, there's a fairly clear pattern in the last few years: anomalies deepen through the melt season, recover by the end of the year, and are closest to zero around February or March. This is why we have the annual November chant of "what anomaly?" from certain quarters. In the winter, the arctic ocean all freezes, so the sea ice extent reaches a natural level. This year, it's not happening in the same way. All 'weather', of course - we hardly have any years with these deep anomalies at all.
2006 was a bit like this (but at a higher level).
The Arctic Ocean is all frozen as usual - extent limited by land. This year is unusual by Hudson Bay and Hudson strait being clear of ice.
http://igloo.atmos.uiuc.edu/cgi-bin/test/print.sh?fm=12&fd=24&fy=2010&s…
It seems quite likely that Hudson Bay and Strait will freeze over soon and we will be back on the lower edge of the usual range.
Thin ice forming late will have missed some of the snow. Less insulation from snow and thinner ice means more heat loss from water and ice thickness will be able to catch up quite a lot or even exceed usual ice thickness. I think this is a sensible reason to doubt the idea that the volume trend is better than extent trend for estimating when arctic will be ice free in summer.
crandles, the ice in HB actually DECREASED when that downward tick occurred. You can view it at cryosphere. The other thing is that there is very little ice outside of the Arctic Ocean, while there usually is a lot.
Also, Chris, IIRC overall volume has a pretty good correlation with thickness in the main basin. It probably is the best single statistic.
In my fairly uninformed opinion there is the potential for an abrupt melt of most of the ice. If true, I think what we'd want to look for is a combination of late-forming ice outside the main basin (since it will tend to be thinner), and reduced thickness in the main basin, then wait for one of those cloud-clearing highs to set up through June and July. There does seem to be a trend in all three of those factors.
William, Joe Romm notes that the USN chief oceanographer is officially stating that he expects a month of ice-free conditions by the late 2030s. This seemed to me consistent with Maslowski's projection of the first ice-free day about 20 years earlier, but Joe disagreed. It seems to me that an entire month ice-free is rather a lot, given the implications for ice conditions going in and out. Also, AFAIK none of the GCM-based projections are showing anything of the sort, which leads me to wonder which research other than Maslowski's (who is after all the USN's in-house modeler) could have formed the basis for the projection. Your opinion?
[I wish people would link to things (you can get away with one link before the silly WP spam filters kick in). You mean this I think, which points to this. My immeadiate reaction is "its in the Daily Mail, therefore it is false". And the article says "Yes, the U.S. Navy has a climate change task force. With 450 staff... He predicts an ice-free Arctic in late summer by 2020." But the post-article clarification says David Titley, Rear Admiral of U.S. Navy and Director of Task Force Climate Change, has asked us to clarify the following points. He said: 'Task Force Climate Change has a staff of five, but through our partnerships with other federal agencies and scientific institutions, we interact with about 450 persons. I have frequently expressed, on the record, that I believe the Arctic may experience three to four weeks of relatively ice-free conditions by the mid to late 2030s. so, I was at least in part right.
As to the substance: it sounds like twaddle to me. If this Rear-Admiral has some scientific reason for believing what he says, and can come up with some meaningful defn of "relatively ice-free", then I'd be interested to hear. Apparently he has frequently said this stuff on the record, but doesn't trouble himself to point to the said record. So yes, I'd guess this is based on Maslowski's stuff which I think is twaddle.
Sigh. I looked a bit harder and found some testimony (via Romm. But all this talk of death spirals is just stupid). There is some really dodgy language in there: September 2007 saw a record low in sea ice extent and the
declining trend has continued -- September 2010 was third lowest extent on record for example is doing its best to muddy the waters: sea ice is on a long-term decline, of course, but the trend since 20007 is up not down, since 2007 was so low. However, that testimony was in Nov 2010 and rather pointedly the only "prediction" in there is Regardless of changes to sea ice, the Arctic will remain ice covered in the winter through this century so it looks rather to me as though this bold admiral is rather more cautious in his language when speaking to power -W]
-W]
http://www.flickr.com/photos/37346653@N05/5301109203/
Observations from Graph:
Largest range is early Oct just after minimum. (Probable cause of this being after minimum rather than at minimum is presumably going to be the albedo feedback effect)
March range does seem slightly larger than Jan and Feb but that might be chance.
Smallest ranges seem to be late May, early June, Nov excluding last few days, and (until this year?) December exc first few days. (The spike late November early december could easily be chance.)
Suggestions for possible causes of range variations:
Until this year, December range was much smaller than at other times and would seem to correspond to when the ice is most clearly hemmed in by land.
After this, extent outside of Bearing Strait increases perhaps giving rise to increasing variability upto March then reducing again to late May when the ice again shows a hemmed in by land distribution. The extent reduction inside the area hemmed in by land in summer is much larger than the extent increase outside Bearing Strait in winter so perhaps this could be a reason for the variability being much greater in summer than at March.
[Thanks for that. I would say that if you discard the exceptional 2007 min, then the range seems fairly constant throughout the year. You could pick out variations but a null hypothesis would be All The Same -W]
FWIW, my gut feeling agrees with this: "Regardless of changes to sea ice, the Arctic will remain ice covered in the winter through this century". I find it hard to imagine an Arctic Ocean so warm that it can survive six months of night without icing over.
[Oh yes, sorry if I wasn't clear: that quote is nothing but the bleedin' obvious and of no value at all -W]
Thanks, William. Sorry to have put you to that much effort.
Expecting a year-round sea ice-free Arctic by the end of the century would be bold indeed. That being so the comments seem self-consistent. As to Maslowski's twaddleness, we shall see soon enough, his latest date being 2019.
Regardless of changes to sea ice, the Arctic will remain ice covered in the winter through this century". I find it hard to imagine an Arctic Ocean so warm that it can survive six months of night without icing over.
Yet at the northern tip of Ellesmere Island, there is a fossil forest that grew in conditions never below freezing. Both isotopic and growth patterns show that the minimum temperature was above 5C. The growth patterns also show that the forest grew above the Arctic Circle.
Small plug: my amateur summer ice forecast, winter ice disappearance closer than you might expect. Still waiting for someone to convincingly debunk my Arctic heat budget thoughts...
[Yeah, sorry, I'll get round to it :-) -W]
Expanding on Phil's point, Nick, bear in mind that the planet has been warm enough to preclude winter sea ice formation many times in the past. It's the present deep freeze that's unusual in the planet's climate history (the Phanerozoic anyway). The cold is only possible as a result of a sharp imbalance in the plate tectonic drivers of climate (the balance between CO2 emission and sequestration). BAU drives us back into conditions that will allow for little ice, and the sharpness of the applied forcing (relative to the slow pace of negative feedbacks) is more than capable of driving us to a paleogene-like climate state. Unfortunately, worse than that is possible (see Hansen).
By "imagine an Arctic Ocean so warm" I meant "imagine an Arctic Ocean becoming so warm this century". Over geological timescales the impossible is routine.
Geologic time is not needed to double CO2, will very probably happen this century. The impossible may well become routine.
Sea ice remains very low, especially in Baffin Bay / Labrador Sea / Hudson Strait.
Testing - Doubt this will work. Volume is ticking along - 1457 $10 contracts traded.
[Sorry. I wasa bit slow approving this. Post in progress... -W]
Did you get around to 'convincingly debunk Gareth's Arctic heat budget thoughts'?
[That slipped. But thanks for the hint, I should look again. Also, it is about time to start looking at this year -W]
[I finally got round to it: http://scienceblogs.com/stoat/2011/02/this_years_sea_ice.php -W]