
Obscure, perhaps, but I claim it was by request. My sermon is taken from Removing Diurnal Cycle Contamination in Satellite-Derived Tropospheric Temperatures: Understanding Tropical Tropospheric Trend Discrepancies by S Po-Chedley, T Thorsen and Q Fu, but before I get onto that I need to snark a bit; where would the world be without such?
One satellite data set is underestimating global warming?
 I know that one! Its RSS, isn't it? Wait... you mean it isn't? Its UAH? I'm confused. And so are the folk in the SS comments. We all know that RSS is the one that "underestimates" "global warming". You have to be bit careful about exactly what you're talking about, but lets say its TLT, because that's the one that is "troposphere" or was close as any of these come to that. Wiki has values up to 2013-13, and HotWhopper has values to 2014... 1.38 UAH compared to 1.26 RSS. So, why are SS picking on UAH?
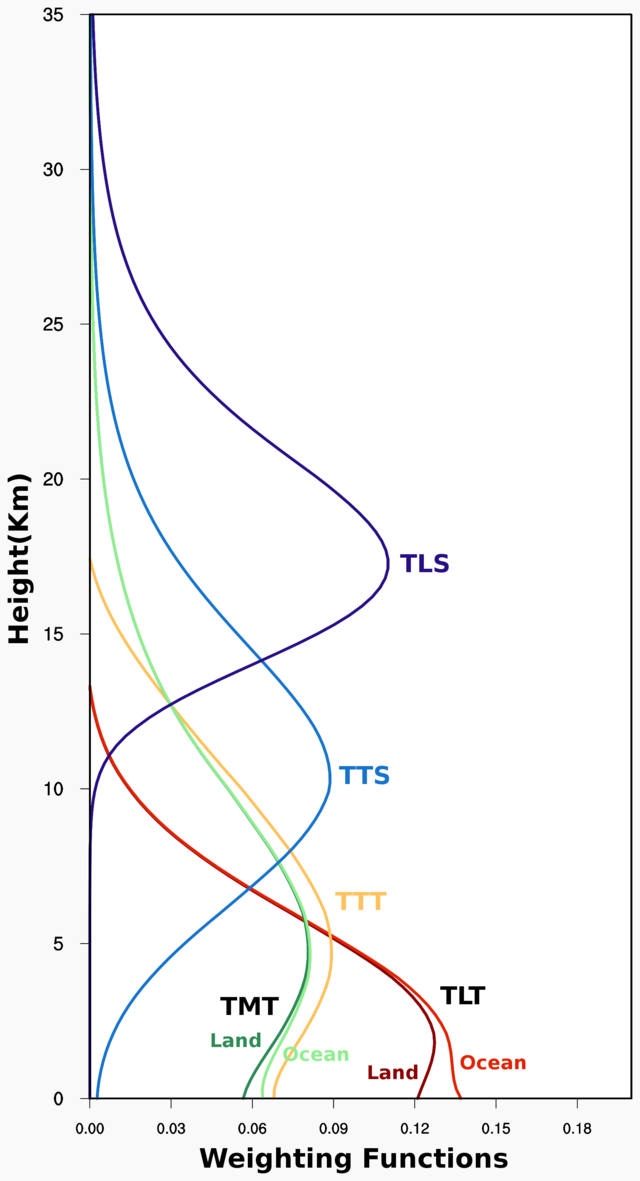
Well, firstly SS, and Po-Chedley, are talking about TMT not TLT. TMT is "real", so its better to talk about; but its too high so TLT is more interesting, which is why it was invented, even though its "synthetic". Refer to the picture, and the wiki article if you don't understand. But more importantly, they're only talking about 20N - 20S, i.e. "tropical", temperatures, which is fair enough - you can talk about any bit you like, but if you do that, and headline your piece "global warming", and don't clearly state you're only talking about the tropics, people are apt to get confused.
Enough dull snark, on with the paper
Yeah yeah. Its about TMT, so lets switch to that. It also points out there's a third series - Zou and Wang, probably the same as NOAS STAR - which essentially agrees with RSS and disagrees with S+C. Is there anything here other than S+C wrong again?
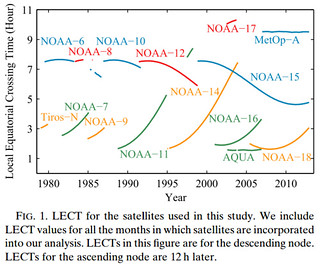
So, there are various sources of error in a temperature series from satellite, and the most serious of these is believing the idiots who tell you that a satellite based temperature series is simple and more reliable than a surface based series. Cast the bozos aside, and the two most interesting errors we seem to have left when constructing the satellite series, at least in TMT, is diurnal drift and the "NOAA-9 overlap problem", which turns into the "NOAA-9 warm target factor problem". Which are both fairly familiar, and both quite well described in the paper, so I won't worry that I can't lay my hands on a good description of them elsewhere. The pic helps; you see the little overlap with NOAA-9 clearly enough, which is a problem because the series need to be stuck together with intercalibrations, not absolutely, much like the solar radiometer measurements.
People diss S+C for getting the NOAA-9 calibration wrong, and such people are likely correct, although S+C haven't admitted it yet. Don't hold your breath. But its only part of the problem, and this paper is muchly about the other part, E/W drift, i.e. the polar orbiters - which nominally remain at the same solar hour all the time - actually slowly drift with respect to the sun. As the picture shows. Po-Chedley tell me that this drift effect is worse over land, because the diurnal range in skin temperature is higher there (supported by their fig 2, which shows about a factor of 10 difference land/ocean. That same fig also shows minimal corrections over the ocean, which you'd hope would be true, and they take as evidence that their calibration corrections are, errm, mostly correct. Though also that the differences in oceanic correction between the MSU and AMSU indicate that not quite all is well). If you want to correct out the drift changes, which can be larger than the climate changes you're interested in, you can apply a correction based on a model of diurnal temperature from a climate model (but ZOMG! Models! However, that reaction is stupid, so ignore such bozos) or you can do some weird half-arsed thing ("UAH produces an MSU TMT diurnal correction based on temperature comparisons between three coorbiting satellites carrying AMSU with different local sampling times") and then "attempt to use [AMSU] during periods when diurnal drift is small". Weirdly, Christy thinks that S+C's method is best, and everyone else disagrees.
Simultaneous nadir overpasses (SNO)
Po-C and friends are keen to tell us how they've reduced inter satellite calibration problems, by SNO. This seems plausible, but I'm not judging the details: by comparing simultaneous overpasses in polar regions (the (A)MSU, being polar orbiters, meet near the poles every now and again, so presumably can be compared then). So: In this study, we use the most recent version of the level 1C (L1C) MSU/AMSU data produced by NOAA STAR, which was newly released in 2013. The dataset has been described by Zou and Wang (2011, 2013) and The NOAA IMICA calibration is both effective and important to our analysis. There's a whole pile of other processing description in the paper - do read it, this is J Climate not Nature - one step of which, of course, is to throw out anything too many SD away from what is expected, again outraging the ZOMG-only-use-raw-data Nazis, but they are fools so again, ignore them.
Observationally based technique for removing
diurnal drift biases
So, with - we hope - intersatellite calibration problems minimised we're left with the drift problem. Because of concerns with the models - I sense, not their concerns, but other people's concerns; still, its nice to try multiple angles on a problem - Po-C et al. try to develope a different way to tease out the drift corrections.
The actual correction for diurnal drift involves throwing a regression equation at it; I didn't bother read the details so can't tell you if its any good or not; most likely the only way to know is for someone who cares to attack it, and see how they respond.
Broadly, from the look of fig 2, their corrections don't differ strongly from the GCM-based ones. But that broad-brush eyeballing is wrong, as their fig 3 shows.
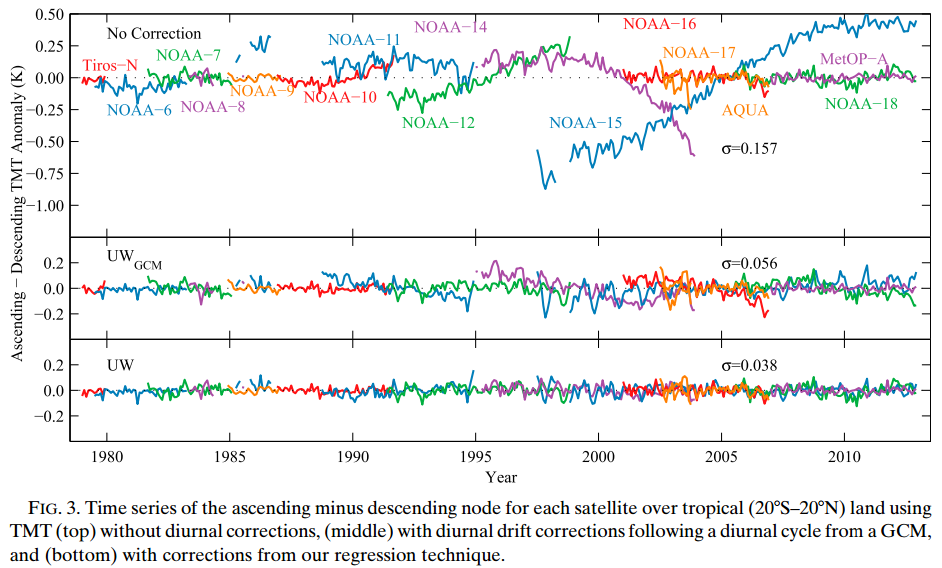
Their stuff does appear to have done better than the GCM approach, although the difference isn't huge. See-also their fig 4.
And the winner is
The end result is a TMT trend of 0.115 +/- 0.024 oC / decade, compared to NOAA with 0.105 (though note that this analysis did start out from NOAA's dataset, before applying their new drift correction, so its by no means independent of it), RSS with 0.089 and S+C with 0.029. So, its clear who the loser is. But remember, this is TMT, not the somewhat more familiar but synthetic TLT, nor is it the surface temperature. They construct a "T24" which is somewhat like TLT in that they try to subtract out the (cooling) stratosphere from the TMT using other channels; and end up with 0.160 (NOAA: 0.149; RSS 0.125; and trailing the field S+C with 0.056). That then allows them to work out the amplification ratio, or troposphere-to-surface warming ratio, which is expected to be greater than 1, and indeed is. Unless you're S or C.
Spot the deliberate error
Po-C can then plot the difference in TMT timeseries between theirs and others.
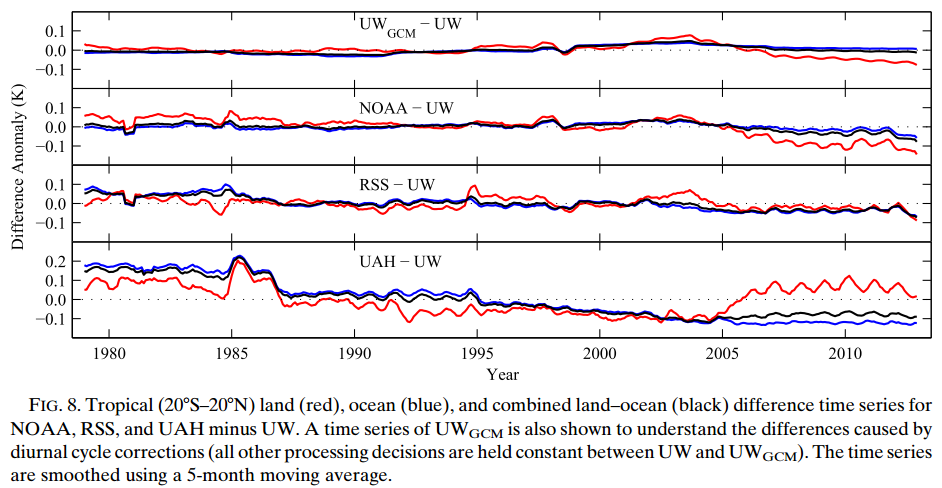
Notice the painfully wiggly bits, mostly on S+C. That's not nice.
If TMT is buggered so is TLT because they are constructed from the same MSU channel. TLT being the diff between limb and nadir views of channel 2 is especially buggered if the nadir views are buggered.
Bugger
Makes TOb, UHI and station move series adjustments look like high precision.
Hey, this is a nice review of the situation. I too had noticed the confusion between TLT and TMT over at Skeptical Science. It's also funny because even considering just TLT itself (which is *not* the subject of Po-Chedley et al.) the relative positions of UAH and RSS flipped a few years ago -- so people who always used to cite UAH LT before 2010 now cite RSS LT, and vice versa. It's enough to make one cynical.
But ... it does look like Spencer & Christy are badly wrong about TMT. Roy is still keeping silent on this. I do wonder whether that has anything to do with the long-delayed arrival of UAH TLT v6. Somebody named "David A" (maybe David Appell) has been poking the readers of Roy's blog about this in comments over there, but Roy has not yet taken the bait.
The one thing that I think you don't cover, WMC, is the extent to which this "tropical troposphere hotspot" has been a frequent talking point of the pseudo-skeptics. For years and years we've been hearing about "no tropical tropospheric warming". Maybe this has now been neatly resolved.
The big question, obviously, is whether and how this carries over to TLT, which is the one that people seem to care more about rather than TMT. It's not as simple as saying "obviously yes" because while for TMT the new analysis nicely resolves a previous discrepancy between RSS (reasonable) and UAH (too low) in the case of TLT any change that increased the trend for UAH would make the discrepancy with RSS bigger not smaller. Of course it's possible (indeed likely) that both RSS and UAH are wrong, and both are too low.
Finally, thanks for emphasizing all the ways in which deriving estimated "temperatures" from TMT or especially TLT is not simple and straightforward. I keep running into arguments with fake-skeptics who claim that the satellite measurements are "real, raw, untampered data" in contrast to the homogenized, adjusted, un-raw surface temperature measurements. In reality, the satellite microwave temperature data are more problematic than the surface temperatures.
Aha. While I was writing that, Roy finally seems to have posted something on his blog. I'll have to go see what he says. He doesn't sound happy.
No, actually Roy still is ignoring Po-Chedley et al. He's grumping about how someone is saying mean things about him in the Guardian. But there's no substance. He even deliberately conflates the issues of "change in reported trend due to different time periods" vs "change in reported trend due to correction of errors".
For example, in this 1999 article from the San Diego Earth Times, John Christy is quoted at length talking about the negligible trends. The reported decadal trend in UAH from Jan. 1979-Dec. 1998 was "0.06C/decade".
For the same period in the current version of UAH TLT, the trend is twice as big (0.11C/decade).
That difference is not due to a change in time period -- I used the same time period to calculate the trend in the latter version. It's due to the discovery of errors in older versions of the UAH series.
Roy Spencer knows this perfectly well, but he dishonestly chooses to obscure the issue in his latest blog post.
And still no actual response to Po-Chedley et al. This is embarrassing.
It took me about 10 minutes to do what Roy Spencer avoided doing in his new post.
He shows a graph from the Guardian, which positions various points over time to show how the UAH temperature trend increased following the correction of errors.
Roy then posts his own graph, and strongly implies that the increases in the trend were due to additional years being included in the trend, rather than the correction of errors.
What he should have done is put the two graphs together, like this. The fact that the UAH trend has increased over time is due to both the inclusion of more years AND the correction of errors in UAH TLT.
[I think you're right; RS isn't being honest. I recall the years when his "reliable" satellite series used to show cooling; pretending that he didn't make much of that at the time, and that it was all shown to be wrong, is dishonest of him. And his over-the-top rhetoric does him no favours except with his choir; though since those are the only people who'll be buying what he's selling, I guess he may as well sing to them -S]
Is actually the rumor right that the software UAH uses to process the microwave satellite data is not public?
[AFAIK that's correct. Cue the obvious crickets from the usual quarters that would be shouting loudly if anyone they disliked did the same -W]
I share Ned's ire- C&S went all rocket scientist op-ed in Science to assure ex cathedra NASA that satellite temperatures were flatlining. In 1990 many cited that assertion as fact in the policy literature, myself included.
Roy is still maintaining his silence both about Po-Chedley et al., and about UAH v6.
He complains a lot about people saying mean things about him and/or about his TLT temperature record. He wants to be seen as a latter-day Galileo.
9 May 2012
"All of this will soon be moot, anyway. Since last year we have been working on v6.0 of the UAH datasets which should be ready with the tropospheric temperature datasets before summer is out."
Over 3.5 years. Hmmm.
Is it time to give up and make v6 the Po-Chedley Fu version?
Would that sort of comment provoke a response? ;)
"Is actually the rumor right that the software UAH uses to process the microwave satellite data is not public?
Ya Victor. Long ago when I was going after Jones and hansens code, a guy named "magicjava" picked up the ball trying to get UAH and RSS code. FOIA and all.. he eventually ran up against ITAR cause he tried to go back the the rawest bits and bytes.
on occasion you will see me remind people of this. nobody cares.. weird huh
ITAR is very serious as in: You will go to prison. The Obama administration is in control of these export control rules, so I doubt that the data processing contains a hidden cooling bias.
Most skeptics are lukewarmers so there is no requirement for the temperature trend to be negative. The satellite temperatures are in agreement with the radiosonde data.
[What do you mean by *the* satellite temperatures? Do you think there is only one series, or several which agree closely? If so, you haven't read this post -W]
Therefore, they can be looked at as a means to extrapolate radiosonde data across the globe. Obviously, each step will have an error band including the satellite measurement itself. As usual in climate science this error band is relatively large compared to the signal because the amount of warming that has happened to date (natural or man made) is so very small compared to the diurnal, seasonal and year to year variation at any given location.
She does exist.
Our tasty rabett found a page with the spaghetti code of the UAH microwave radiometer retrieval. There is even an ATBD, which could be used as tomato sauce.
To cite a comment: It is going to take a long time to wade through their code-- Braswell does some aggregation and processing, those data are passed to Spencer's code and the results from Spencer's analysis are then finally passed to Christy's code. But then again, no one has suggested that estimating temperatures from brightness data would be trivial.
There are actually 3 subdirectories in the zip file: Braswell, Spencer, Christy. :)
[Thanks. I've blogged it. Note that, at first blush, it doesn't cover MSU -W]