
I have been presenting various versions of a model to predict the outcome of upcoming Democratic primaries. The earlier version of the model worked like this: Make some assumptions about the ratio of voting preference (for Sanders vs. Clinton) among the different major ethnic groups, and using the known distribution of said ethnic groups, predict the future.
I started out with the assumption that among whites, the ratio would be 50:50, based on one datum, the outcome from Iowa, which is essentially a white state. I used a bias for African Americans and Hispanic voters favoring Clinton. That worked well to predict several primaries, with the caveat that what happens in Vermont and New Hampshire would be biased by favorite son effects.
The second part of the model is to update the within-ethnic group biases with further information as it became available, using primarily exit polling. At no point did polling for future races come into play except to demonstrate in advance that the model might work (by comparing polling for some Super Tuesday state polls with the model predictions).
Again, the model predicted Super Tuesday's outcome pretty well, but there were some surprises especially in order of magnitude where Sanders won. In those states I had predicted either something close to a tie or a modest Sanders win, and he did better.
Now that there have been several other races (Louisiana, Nebraska, Kansas, Maine, Mississippi and Michigan), with more exit polling and some more surprises (that, again, I predicted in polarity but not magnitude) I can see that the model works very well in predicting states where Clinton ultimately won, but under-estimates Sanders' delegate take in states where he won. And, the states where the latter happens are those that are not part of the "deep south." This indicated that both "black" and "white" voters (and maybe "hispanic" voters) are doing different things in those different states, and that ethnic mix alone is insufficient. I also considered that whether or not a primary is "open" or not may be a factor (or a primary vs. a caucus) and I'm sure this has an effect. However, the simple characterizations of "open" vs "closed" or even "caucus" vs. "primary" come nowhere close to actually capturing the real variation among these kinds of states. Plus, sadly, there is a general lack of exit polling information for some of the odder states, so the two factors (a different ethnic pattern vs. the effect of the kind of contest) can't be compared in relation to each other.
So now I have a new model. This is exactly the same as the first model, but uses different ethnic patterns (how each ethnic group is likely to vote) for states that are "southern" (deep south, not the southwest) vs. states that are not "southern". This could have been done by looking at the proportion of African Americans in each state to produce an adjustment, and I may well do that eventually, but for now a simple binary distinction seems appropriate. I calculated, using exit polls, ethnic patterns for these two kinds of states.
I have data for eight southern states indicating that the ratio of Clinton to Sanders support for White, Black and Hispanic should be 60-40, 88-12, and 71-29. In contrast, for non-southern states, for which I have data from six states, the ratios are 45-55, 69-31, and 46-54. Note, however, that this "black" ratio is based on only four data points, and the hispanic ratio for both types of states is based on one state each.
In other words, Black voters always favor Clinton but much more so in southern states, white voters favor Sanders in non-southern states but the reverse is true in southern states. Hispanic voters strongly favor Clinton in southern states, and mildly favor sanders in non-southern states.
Applying this model to the past, it does less well than earlier versions of the model did on the first few primaries, and better on later primaries. This may mean that there is a change in voting behavior, or simply differences in the states that happen to go earlier or later. Indeed, the current model still somewhat underestimates Sanders performance where he does well, and if the smaller number of later states (i.e, excluding Iowa, New Hampshire and Nevada) is used to estimate these ratios, the White ratio is unchanged but the Black ratio works a bit less against Sanders. But at this point we have broken the data down into too-small units and are nitpicking. (By the way, if I recalculate the ratios weighing for state population size, which might be better because larger states may be better samples, there is no significant difference. More likely, a weighted average that ranks the quality of the exit polling data would be more logical and useful, but I do not have any such quality measures.)
When retrodicting previous contests with the new model, to see how well it works, the outcome isn't too bad. It fails to predict Iowa, Nevada, Colorado, and Massachusetts, but is close. The new model predicts a 65-65 split in Michigan, which actually had a 61-69 split, so that's wrong (but a tie is better than the wrong win.)
I could easily adjust the Sanders numbers to make the model predict the outcomes better in those states where he won, and that might be reasonable because of the status-quo part of the status-quo-ethnic model. But it would be an arbitrary adjustment with respect to the ethnic part of the model, so it is better not to.
This model retrodicts that Clinton takes 785 committed delegates and Sanders takes 536 committed delegates to date. By my count (which may vary from other counts because sometimes the delegates are counted funny) Clinton has actually won 769 and Sanders has won 502. That's not bad, I'll take it.
So, if this model is any good, I should be able to tell you now who will win the various races in the all-important upcoming Son of Super Tuesday, next week.
Clinton will win Florida, barely. The model projects a tiny lead for Sanders in Illinois, so that may be a tie. Clinton handily wins Missouri and North Carolina. Sanders barely wins Ohio. At the end of the day (aside, again, from delegate awarding oddities) Clinton will have added 376 committed delegates to Sanders' 314. A Clinton win, but not a big one, is expected for next Tuesday.
Finally, according to this latest version of the status quo ethnic mix model, Clnton will win the nomination. The following graph shows the cumulative delegate count for each candidate, with the first several dates (up to yesterday's primaries in Mississippi and Michigan) using actual committed delegate counts, and the rest using the projections from the model.
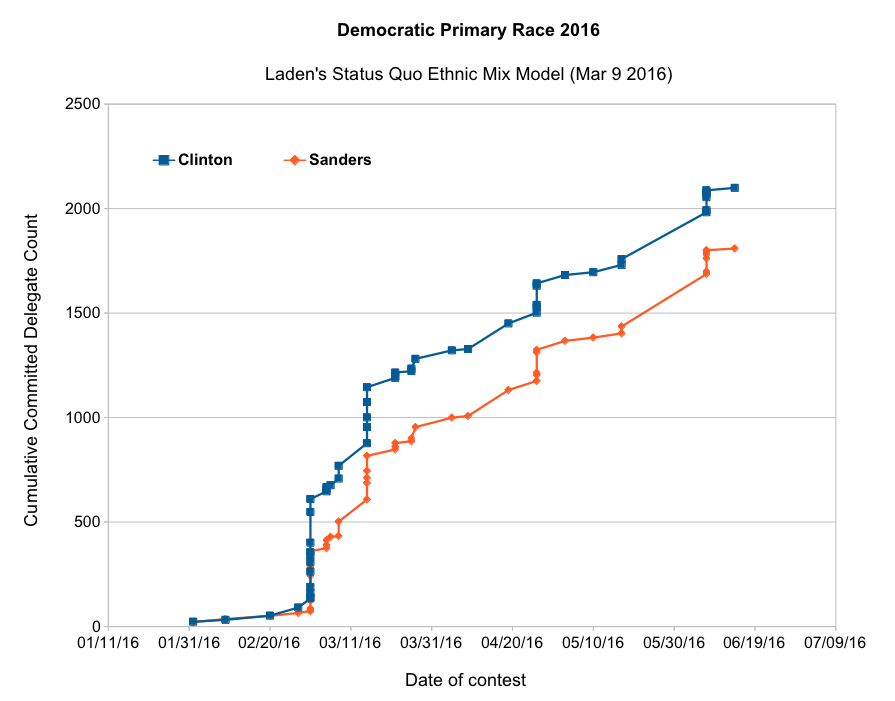
It is very important to note that this model probably underestimates Sanders' performance in a subset of states. In other words, Sanders actual delegate count will be somewhere between the two lines shown here for a few weeks. The question then remains, can he get his line to cross Hillary's line?
Note that in this scenario, Sanders wins both New York and California, but just by a little. If there is a handful of big states where my "just by a little" actually turns out to be "by a surprising amount" there could be a different outcome. Indeed, Sanders is expected to outperform Clinton from New York onward in many primaries, and if he does "a surprising amount" (which by then won't seem like a surprising amount anymore) wherever possible, he could pull ahead.
Sustained, but also possibly increased.
"the ratio of Clinton to Sanders support for White, Black and Hispanic should be 60-40, 99-12, and 71-29."
I'm pretty sure that "99-12" is a typo unless the ratio is supposed to add up to 111 while the others are only 100, which is technically perfectly fine in ratios, but seems out of place here.
88-12
I still don't see how Sanders could pull ahead that easily, given the proportionality of the delegate counts. He would still mathematically speaking have to win not just by a little, but pretty decisively in NY, PA, OH, IL, NJ and hit the 50-50 mark in FL and NC. (He'd need a net win over Clinton of about 20 delegates per state). And in California, even if he got every single delegate from every state not on the above list (AZ, UT, IN, NM, et al) and did a 50-50 split of the others he's still need a pretty crushing win by my back-of-the-envelope calculation.
Yes his Michigan win was an upset, but the trouncing he got in Louisiana actually meant Clinton's lead expanded. Proportionality means he has to win by a lot, not just squeakers.
That said, I don't mean to dump on your model -- I think it's a good approach though I suspect the openness of a primary is a bigger factor than we often realize. Remember that open primaries will skew the picture of the party faithful who vote in primaries to begin with. Those party faithful would tend to back Clinton for no other reason than she is a Democrat and Sanders hasn't been. (We follow this stuff closely; most people do not, Sanders was a relative unknown compared to Clinton just a few months ago). Not that they are fools or votebots, it's just that people have habits. I'd not expect voting to be much different -- Sanders in a closed primary has to get people to vote for him to a greater degree than in an open one where you can go find your voters and get them to the polls.
Jesse,
I have a question for you and Greg and all our fellow political junkies. I think my numbers are sound if approximate.
In presidential elections of late, we observe that White Males break (say) 45D v 55R.
In the primaries for the Dems, we see that White Males break (say) 45H v 55B.
Can anyone explain that? If H is "Republican Lite" and B is "True Progressive", shouldn't it be the other way around?
(Greg, this is the kind of thing I think your broad-brush assumptions hide.)
I think they are not the same males. I think a good portion of the Extra Bernie Male Fraction (EBMF) is that subset of citizens who don't normally vote at all, but show up now and then because it becomes the thing to do. They are the people who put Jesse Ventura over the top in a three way race in Minnesota a few years ago. They are unreliable voters year to year, largely disengaged, and so they tend to be less partisan.
Another part of the HB difference is simply sexism, mild and in the background mostly, where guys are going to tend to vote for a guy and against a girl, combined with the basic idea that if all else is equal (and to MANY voters, Sanders and Clinton are very equal compared to Trump/Cruz!) you vote for the woman because it is about time to have a woman in the White House.
So I think the RD and HD difference is not a parallel cause, exactly, but for different reasons.
In addition, although the H camp has wisely moderated their tone of late, past rhetoric has tried to suggest that women have an obligation to step up and vote H (1970's style?) just because. Note the kerfuffle a little while ago over millennial women backing B.
As with some of Zebra's comments, there's been a sort of meta-emphasis in the H group on herding in lockstep. It's a way of creating white noise that obscures problems with this third-way-oligarchy stuff. It seems a little stale to me, but it may have efficacy in quarters where "keep on keepin' on" is an ethic.
@#6
Basically it's because the Democratic primaries attract a more liberal portion of the demographic group; those who would vote Republican in the general election aren't generally voting in the Democratic primaries. Thus of the 45% of the larger group that are Democrats, 55% of those prefer Sanders (but will probably vote for the Democrat even if Clinton is nominated.) This 55% of 45% is just under 25% of the entire group, but generally the most liberal 25% of the entire group. The 45% that support Clinton are 45% of the 45% who vote Democratic (or just over 20% of the entire group.
I hit "submit" a bit early. To continue:
The total group (white males in your example) can be divided into three groups: [1] republicans (55%) [2] democrats supporting Clinton (20%), and [3] democrats supporting Sanders (25%).
Assuming both groups of democrats vote for the democratic candidate in the general election, we have your 55-45 republican split. But the republicans don't vote in the democratic primary (they're the guys over there choosing between Trump and Cruz). So only 45% of them vote in the democratic primary, and so in the primary it's your 45/55 H/S split.
So the answer to your question is that republicans cans don't vote in the democratic primary.
Greg,
That last sentence is pretty confusing. But let me make a clarification on terminology before going on.It isn't sexism to say "it's time for a woman President", just as it isn't racism to say "it's time for an AA President".
When there was great enthusiasm and turnout for Barack Obama from the AA community, that might be termed "ethnic solidarity"-- it wasn't because they thought whitefolks were less qualified for the position by virtue of being white. The latter would be racism.
Likewise, sexism would be thinking that a woman couldn't possibly be (for example) CinC material. It isn't "boys voting for boys", it's boys being uncomfortable with having a woman in charge. That is, attributing lack of competence (or other characteristic) based on gender.
But, moving on from that, and again I am pretty sure about the approximate numbers, turnout in the Dem primaries has been down, not up. So (and I know you aren't super-invested in your model, and you aren't putting a lot of time into trying to defend it) you are weaving a bit of a just-so-story with your ephemeral, "hidden variable" voters.
RickR: The premise of Greg's model is that "It is well established fact, undodgable fact, that voting patterns vary across ethnic groups." So if we take the sub-group White Males, as I said, consistently voting "conservative" rather than "liberal", you can't then say that the subset who participate in the Dem primaries have an opposite distribution.
(And still defend the model.)
@#11
Take the group white males. 55% of them vote republican, both in the primaries and the general election. 45% of the vote democratic, both in the primaries and the general election.
Not take the 45% subgroup that votes in a democratic primary. 45% of them vote for Clinton, 55% of them vote for Sanders.
If you want to claim that we must to assume, for some level of consistancy, that those white males voting in the republican primary would, if faced with the choice between Clinton and Sanders, make the same 45/55 split, go right ahead; it doesn't affect the analysis at all. What leads to the difference being asked about is based upon the fact that republicans don't vote in the demographic primary, which leads to that difference, even if we assume that the republican white male voters would, if faced with a choice they are not in fact being
faced with, would break in exactly the same way the democratic white male primary voters do.
And this assumption of consistancy of groups is a simplifying assumption that is, well, false. The African-American vote share for Sanders, for example, varies from 5% in Arkansas to 31% in Michigan. We can assume an average value of 17%, but this is one of sources of error in matching the results of the model to reality. Which does not mean it may not be close enough to be useful, but it is an estimate based upon simplifying assumptions that are, strictly speaking, wrong.
There was that twenty point reversi surprise upset in michigan.
Does your model reflect any *hidden* dependancies on 'official' polling data? I ask because I'm given to believe that only those with landlines are counted in those polls -- old fogies.
""beep, beep, beep: The pollster who now calls is already on your lawn. beep, beep, beep
Rick 12,
Well, yes, the point I was making to Greg is that this invalidates his assumption.
But now you are claiming that D WM voters are "more liberal" than their R counterparts based on the split in the primaries, which is circular-- they're liberal because they're liberal. It doesn't answer my question.
I deplore unnecessary recourse to elite-speak, but much of the dithering over sex ratios can be most succinctly explained as the fallacy of division: i.e., the technical term for the wrong assumption that a characteristic of a group as a whole can be imputed to every portion of that group. If males as a group, in the U.S., are more conservative than females as a group, it does not follow that Democratic males (who are selected for being less conservative than average) must be more conservative than Democratic females.
Consider a reverse argument: because black Americans are less conservative than whites, black Republicans must be less conservative than white Republicans. This cannot be assumed to be true. In fact, the few black Republicans disproportionately often seem to be the extremely religious, who are more conservative than average.
By the way, every group in America is skewed towards voting mostly for one party or another, and partisans of both parties have an ugly habit of assuming that the skew in groups favoring the other party shows that those groups are biased and unworthy of having political influence, whereas the groups that skew in their own direction are the only groups that matter or should matter. Republicans are increasingly losing with every demographic but rural white men? Well, those are the only people whose opinons and concerns are important; everyone else are sinners or Takers who don't count. Clinton is increasingly losing with everyone but African-Americans? Well, a person who can't win the African-American vote isn't worthy of nomination. Where does that leave rural white Democrats?
Jane #15,
So we are all agreed that Greg is engaging in the fallacy of division?
@zebra (#6) you're assuming the males are the same group. This will differ depending on whether the primary is open or not, but even then, the people voting in the primaries (as a couple of people have mentioned) aren't the same cohort voting in general elections. In fact between the GOP and Democratic primary voters there's rather little overlap, even in an open primary system. (Some of this is cultural- Brits and Canadians, I suppose, are more into strategic voting)
@jane while to a degree you're right -- parties will go for who votes them in -- it's also true that parties will try to win back voters if they think the new group can get them to win. This is why the Democrats moved to the right -- the party elites were upset that many Democrats voted for Reagan. From my end I think many misread that phenomenon as a problem with policy in itself; I'd chalk it up to a screamingly successful Southern Strategy (or Southern Strategy lite in Northern states).
And it's not crazy to say that if a certain group of people is unlikely to vote for you that you take your time and energy elsewhere. People who do racist things are unlikely to vote for Obama and are unlikely to be convinced to do so; so at a certain point you have to cut your losses and focus somewhere else.
This is my huge issue with the Democratic party (even though I vote for Democrats). To me it was a losing game to try and out-conservative Republicans, you have to man up and take an unapologetic stand for certain progressive causes if you want to win. Otherwise your victories are bot solid enough to survive any challenges.
Jesse,
Let me clarify this because, while it's all interrelated, the points are getting mixed together.
1. Everybody seems to agree that Greg's model would be better if there were less simplification/generalization. But that's easy for us to say since we don't have to do the extra work.
2. RickR: When I ask "Why do WM in the Dem primary vote for Bernie, you say "because they are more liberal". But if we ask "how do you know they are more liberal" the answer is "because they vote for Bernie". It doesn't follow just from voting in the Dem primary that the distribution 45/55 should flip to 55/45.
3. Jesse: I keep saying "Hillary will win the general election but Bernie will lose", because the electorate consistently elects moderates, and Bernie's supporters are extreme, not representative of the population in general.
Your response is: "No, no, you've got it all wrong; don'tcha see, Bernie's supporters are not representative of the population in general! The way to win is to be more extreme!"
Which, sorry, makes no sense at all to me.
zebra #18
The initial question, in #6, was that in the general election the observed white male split is about 45/55 D/R, and in the primaries the Sanders/Clinton split is about 55/45. You, in that comment, seemed to think this was somehow odd, because you seemed to think that if the entire group of white male voters split 45/55 D/R, then the subgroup of white male voters that vote in the democratic primaries should vote 45/55 S/C rather than the observed 55/45 S/C.
Basically, there is no reason, mathematically, to think that the subgroup of white male voters that vote in the democratic primaries should mirror the D/R split in the entire group of white male voters, any more that one should assume that, if in the all black democratic primary voters 17% vote for Sanders, that the sub-group of black democratic voters in Michigan would vote 17% for Sanders, rather than the 31% that was observed, of the black democratic primary voters in Arkansas would vote 17% for Sanders, rather than the 5% that was observed.
Regardless of the D/R split in the general election, then S/C split in the democratic primaries could be anything from 100/0 (every white male democrat prefers Sanders) to 0/100 (every white male democrat prefers Clinton). It is simply not odd that the ratios are different. No S/C ratio is inconsistent with the D/R ratio.
As for the exact numbers, these are empirical results. We know the white males split about 45/55 D/R because they do; this is an empirical measure. The same for the 55/45 S/C split, it is an empirical result.
As for an explanation of these empirical numbers, you suggest it is circular to suggest that some folks have a more liberal (or progressive, if you prefer that term) political orientation than others, and that these folks are more likely to vote democratic and in a democratic primary for Sanders, and some other folks are less liberal/progressive and these folks are thus more likely to vote republican and, if voting in a democratic primary, for Clinton. But then you will then have to accept that there probably is no expiation beyond "that's the way the world turned out to be".
Dunno who will win the Democratic nomination.
But yegods, Iezeus H FSM and for pity's sake that person -Clinton or Sanders had better also win the main event which is the actual US presidential election otherwise as Bender from Futurama would say : "We're all boned!"
https://www.youtube.com/watch?v=x2vjmgtD1_A
Rick 19,
If you go back and read #6, you will see that I said:
"Can anyone explain that? If H is “Republican Lite” and B is “True Progressive”, shouldn’t it be the other way around?"
You appear to be ignoring that second sentence.
I think you are missing the continuity of the discussion I was having with Jesse prior to that, and that's what #18 was intended to clarify.
If we thought that the voting results were completely random, why would Greg make his model, or Jesse and I be arguing back and forth?
zebra
Let's look at a different ethnic group - African-Americans. We know in the general election the R:D split for them is somewhere in the neighborhood of 10:90. But in the democratic primaries so far the C:S split is around 83:17. But 'if H is “Republican Lite” and B is “True Progressive”, shouldn’t it be the other way around?”
Your comment seems to divide the electorate up along a line from uber-republican at one end to uber-progressive on the other, with Clinton being slightly more progressive than the middle center and Sanders being on the far progressive end. You seem to discount the possibility that the white male segment is somewhat polarized with more "bunched up" at the two ends, where the republicans and Sanders are, while, for African-Americans, they tend to be more strongly bunched up around slightly left of the middle, where Clinton is. There is no reason to assume the various groups are evenly distributed along your republican-progressive scale.
Zebra - The public has consistently elected (relative) moderates in ordinary times, when business as usual was not conspicuously disintegrating and the populace was not desperate, deeply divided, and angry. These are not ordinary times. The GOP's leading candidate is a fascist, in the accurate sense of that term, who has studied Hitler's speeches and may be deliberately working from his playbook. In better times, could you have imagined that happening? If Herr Drumpf is nominated and the Dems run against him a woman who is well known for her elite ties, support for BAU, and condescension towards the "little people", we will all be in serious trouble.
Rick 22,
If there is a bimodal distribution as you describe, then each party would have been selecting extremist nominees in the past. But that is not what the data tells us-- each party has traditionally selected moderates (or those who pretend to be moderate, in some R cases.)
So, you have to come up with some better argument. A "normal distribution" where moderation predominates is a well supported model.
jane,
Nonsense. Go read the NYTimes research on Trump supporters.
The center is holding just fine in the USA. Employment is up, the market is up, gay people are having delightful weddings, poor people are getting health insurance, the unfortunate violence we are engaged in internationally is far. far less destructive than it was ten years ago, and there's a really good chance that SCOTUS will once again become an institution that will protect citizen's rights rather than diminish them. Thanks to the efforts of moderates, against vicious opposition.
You bring up fallacy of division-- look up Nirvana fallacy.
Also look up "if if sounds like a Republican troll using every opportunity to slip in negative Republican talking points about Hillary, maybe it is not a duck."
zebra:
You asked about a particular sub-group, white males. Even after the earlier discussion of the division fallacy, you still are insisting that the subgroup of white males is totally representative of the total electorate. Looking at the exit polling, this is simply false; white males are unrepresentative of the larger group of democratic primary voters. There is simple nothing inconsistent with the sub-group of white males being slightly bi-modal white the larger electorate being unimodal.
Secondly, as I noted before, your question is based upon a linear model running from very republican at one end to very progressive at the other, with Clinton being a "republican lite", that is, on the scale between republicans on one side and Sanders on the other. Then you gave some numbers for the three groups you identify (republicans, Clinton, Sanders). The math is not difficult: you are assuming the three groups, as referenced to white males in the entire electorate, are substantially republicans: 55%, Clinton: 20%, Sanders: 25%. Notice that this distribution - which is yours, not mine - is in fact bi-modal; the center group is the smallest.
Now you have several choices. You can reject your linear model, and assume that either Clinton is more progressive than Sanders, or assume that the relationship between the three groups in not a linear one as you supposed in you original comment. This would mean that your original question is ill-framed since it is based on a false linear model.
Or you can reject your suggested data, and say that you made a mistake in the numbers you presented and that Sanders is not really more popular amount white male voters than Clinton is.
Or you can accept that the white male subgroup is non-representative and there is nothing unreasonable in taking it to be somewhat bi-modal.
Now what you cannot do, at least reasonably and rationally, is to present a bi-modal distribution and then reject an explanation of this distribution because it is bi-modal. You presented a bi-modal distribution, and asked for an explanation. You may be able to reasonably reject my explanation, but not because it accurately reproduced the bi-modal characteristic of the distribution you yourself provided.
So you are insisting that (1) the white male subgroup must mirror the characteristics of the larger group from which it is taken, which is a logical fallacy, (2) that the white male subgroup is in a totally representative sample of the larger electorate, which is emprically false, and (3) that an explanation of a bi-modal distribution cannot be accepted it if explains a bi-modal distribution, which is simple bizarre.
SInce you are obviously immune to both facts and reason, I suppose there is no point in continuing this conversation.
Zebra - Look up "ad hominem fallacy." Rather sad.
Yeah, some things are good, for some people. The market is up? Whee - but that doesn't do much good for the majority of the population who have less than $1000 in the bank and aren't buying a lot of stocks. In fact, it means that the disparity in nominal wealth between the stock-holding class and the wage-earning class is getting even larger. Heavily massaged unemployment numbers are lower now, true. That doesn't mean that things are getting better for the "lower" classes. They aren't. Pointing to these numbers to say that everything is just peachy economically denies the experience of a huge fraction of Americans.
Parsing demographics, FWIW, "So, Who Are Donald Trump's Voters?"
http://billmoyers.com/story/so-who-are-donald-trumps-voters/