
At this point in Obama's term, I'm simply hoping that the things I care about, like Social Security and education, aren't mentioned by Obama in his State of the Union address. I've given up on thinking he'll actually institute good policy (lost hope, if you will), and am just attempting a holding action. This is the administration that told Democrats they had to choose between school funding and feeding hungry children, and also has imposed Education Secretary Arne Duncan's failed ideas on the entire country, so I'm not optimistic.
Matthew Yglesias draws our attention to a Center for American Progress report that discusses "educational efficiency." Given the CAP's prominence in progressive circles, I hope, if Obama discusses education during the State of the Union, we do not hear this phrase.
The report begins with the following two demonstrably false claims (p. 1; italics mine):
Our nation's school system has for too long failed to ensure that education funding consistently promotes strong student achievement. After adjusting for inflation, education spending per student has nearly tripled over the past four decades. But while some states and districts have spent their additional dollars wisely--and thus shown significant increases in student outcomes--overall student achievement has largely remained flat. And besides Luxembourg, the United States spends more per student than any of the 65 countries that participated in a recent international reading assessment, and while Estonia and Poland scored at the same level as the United States on the exam, the United States spent roughly $60,000 more to educate each student to age 15 than either nation.
Student achievement hasn't remained flat--in every demographic group, there have been significant gains since the mid-1970s:
Among 17-year-olds, black students gained 29 points in reading during the period in question. This is massively larger than the one-point gain Samuelson chose to highlight, referring to the score gain recorded by 17-year-olds as a whole. And according to a rough rule of thumb which is rather widely applied, ten points on the NAEP scale is roughly equal to one academic year. If we apply this rough rule of thumb to those reading scores, the average black 17-year-old in 2008 was three years ahead of his peers from 1971! And by the way: These gains were recorded even as drop-out rates declined, a fact which Samuelson understands, as can be seen from a passage he includes later in his column... In other words, black students recorded this large score gain even as a larger percentage of the 17-year-old population was being tested, a change which would be expected to lower the average score. (As drop-out rates decline, this would typically mean that more kids were being tested from the lower end of the scale.)Samuelson is technically correct in that scores haven't really increased, but there's a very simple reason for that: the composition of students was not the same in 2008 as it was in 1971. Black and Latino students score lower, and they made up a much larger percentage of the total student population in 2008 than they did earlier. So the national scores, when demography isn't accounted for, haven't really budged. If, however, you look within various groups, there have been large gains...
In fact, looking at the NAEP presentation (pdf), one has to engage in some serious mental gymnastics to declare a supposed lack of gains.
Likewise, the claim that the U.S. is in the middle of the pack internationally also has to be qualified:
If we subdivide the U.S. data in a very obvious way, we observe something, well, rather obvious:
But data available now tells us that poverty, as usual, had a huge impact on PISA reading test scores for American students. American students in schools with less than 10% of students on free and reduced lunch averaged 551, higher than the overall average of any OECD country. Those in schools with 10 to 25% of students qualifying for free and reduced lunch averaged 527, which was behind only Korea and Finland.
In contrast, American students in schools with 75% of more of children in poverty averaged 446, second to last among the 34 OECD countries.
...I've made this point ad nauseum, but I'll make it again, since education 'reformers', like creationists, are refractory to evidence. Until we get serious about reducing poverty, as well as breaking up large geographic concentrations of poverty, our average test scores will be poor.
Given the flawed, evidence-challenged opening, I should have just stopped reading the report, but I'm a glutton for punishment. Besides, it gives me a chance to use the statistical issues with the analysis to talk about statistics.
The overall goal of the report is worthwhile: identifying school districts that either spend their money well or that waste it. Basically, the report asks, for each district, if its math and reading test scores are better or worse than would be expect given how much money is spent on students (adjusted for factors like special needs children, poverty-related spending, etc.) and the percentages of poor, special education students, and English as a Second Language students.
In statistician speak (don't worry, I'll translate into English), the study used regression analysis as implimented by a general linearized model (GLM), where the residual is used as the amount of increased or decreased efficiency.
Ok, now in English. If you remember back to your algebra class, you had to learn this equation, y = mx + b, where m is the slope of a line. If we know b, x, and m, it's straightforward to figure out y. Conversely, if we have a bunch of points for which we know x and y (e.g., school achievement versus school spending), we can estimate m and b. That's called regression. The slope tells us the relationship between the two variables, achievement and spending. The residual can be thought of as the amount of the y variable not explained by the x variable and is the distance from the estimated line (red and blue lines):
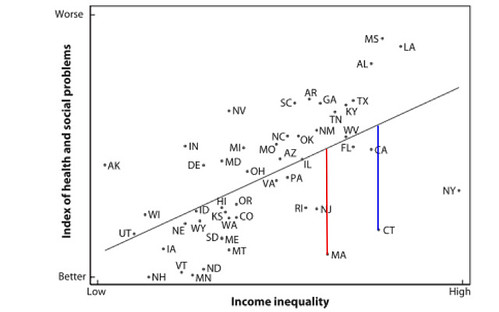
If our estimated slope describes the data perfectly, there won't be any residuals, but, in reality (as shown above), real world data are messy and scatter around the line (if there's too much scatter, we don't take the slope seriously--you can draw a line any which way through a cloud of points).
We can add more variables to the model, so rather than having y = mx +b, we can have y = m1x1 + m2x2 + m3x3 .... + b, where each of the mx's describes a different variable: in this case, one term would describe school spending, another the percentage of kids in poverty, and so on (y is educational achievement). Here too, we will have a residual. In this paper, the residual describes how educationally efficient a school district is. Some school districts will be very efficient: their achievement will be higher than one would predict based on spending and student characteristics. Others will be inefficient: their achievement will be lower than one would predict based on spending and student characteristics.
In principle, I don't have problems with this approach, but there are two issues that bother me:
1) This method assumes that the relationships between the variables are linear. If you look at this figure, they're not: at very low poverty levels (near zero) we underestimate performance, and at high poverty rates, we overestimate peformance. In regression, we can use relationships other than mx that fit the data better. Note that this will lower the residuals, and not necessarily in a predictable manner.
2) There are no interaction terms in this model. By this, I mean the variables interact with each other. We could imagine that a school district that has high poverty and a high percentage of English as a second language students will have an outcome that simply can't be predicted by the poverty rate and ESOL rate in isolation. They interact with each other. (For extra bonus credit, if a model lacking interaction terms has a low average residual, but there are real interaction effects, not including them will lead to overestimating the effects of each term in isolation).
If one were making qualitative statements, these probably won't be problems. In the above graph, using some sort of curve won't qualitatively change the message: some states do better than their inequality rates would suggest, other worse. Curving the line won't really change the message.
But in this report, the quantitative estimate of the residual really matters: it's the basis of the entire report. Incorrectly estimating the residual means that how one evaluates school districts is off. While the report does mention this, I would argue that, in a contentious area such as education policy, one really has to rigorously nail down the numbers. A first pass or preliminary assessment doesn't really cut it, especially when it could be used to inform policy.
An aside, part one: This is why, despite all of that process' faillings, these things need to be peer-reviewed by independent reviewers.
An aside, part deux: Overall, the report's advisory board is composed of progressive/neo-liberal worthies, most of whom don't have the time or the statistical chops to rigorously evaluate the methods. Would it have been that hard to drag in several Ph.D. statisticians? Not only would the methodological issues been addressed, but they might have devised some really smart ways of getting at this.
An aside, part the third: While everyone who uses stats like to use their favorite method as much as possible, even when it's not the best method, GLM users seem to particularly suffer from the hammer-and-nail problem.