
Time for another look at sea ice. Here is the familiar IARC-JAXA plot:
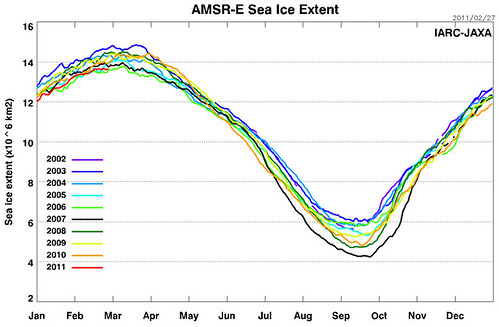
And we see: well, it is looking low, and has been consistently all winter. Not record-breakingly, like it was last December, but even so. Interesting.
This year, I'm not planning to run a book, unless anyone offers to make a worthwhile bet. I'll put up my "prediction", which is the same as ever: the mean prediction is for the trend amount, i.e. the same as last year minus a little bit (5.235, as I recall), and the "bet range" is that plus or minus interannual variation, which as I recall is around 0.5 units. If you happen to believe that this year's ice will be stonkingly low (or, indeed, high), then perhaps we have something to bet about.
C points out that Intrade is offering prices on 2011 being greater than 2007:

and hopefully that chart will make sense for a while. I think I should probably be buying at that price (42.5) since I think 2011 will be greater than 2007. And so, I did.
But the other seaice-y thing I was supposed to do was go back and rip to shreds Gareth's prediction of an ice-free Arctic by 2016 (I know, he didn't quite say that, but never mind, I'm eggagerating for effect). Tell yer what, I'll quote him:
if the relationship between ice volume and extent evident in the NSIDC and PIOMAS data over the last 21 years continues in the near future, then the Arctic will be effectively ice-free in late summer sometime between 2015 and 2020
Now there area couple of problems with what Gareth has done. The first is (on taking a second look) rather striking: he hasn't done the projection properly. He has taken the trend-line over the last, say, decade; but he has anchored that trend on the last value. Which is lower than the trend line. So he hasn't projected the trend line itself forward, though he has (I assume) used the right slope. For volume, that makes a difference of about 2 units (by eye) which is worth about 5 years (on the 2001-2020 version). Similarly, the thickness will be strongly affected. However, I disagree by more than that.
Fundamentally, I think his projection of volume and thickness trends forwards, and using them to derive extent, is non-physical. Or perhaps, not using the best quantities. I think the extent (or, equivalently, the area) is more fundamental.
This is driven by my view of the sea ice as part of the energy balance of the Arctic. Ice free ocean (in winter) is going to freeze and make metre-thick ice. And if it survives the summer, it will thicken over time, until advected away and melted, or melted in place. And there is a certain "natural" area of winter ice. So unless something unusual and exciting happens during the spring and summer (as it did in 2007) the ice will follow its usual patterns. I'm not explaining myself very well, I can tell. Let me try just a little bit more: in winter, there is "excess cold" available: the ice freezes up, till it is ~1m thick, and then it doesn't grow much more, because of the insulating effect (waves hands for effect). But in summer, melt is ~linear on the warmth available. So there is a sort of stabilising effect.
Of course, I may be wrong; this isn't my field any more. And its not as if I'm betting the farm on this. But it is what I'm basing my "predictions" on, and why I still expect there to be summer ice n 2050.
I still need to fold this pic I drew last year:

into my analysis. That suggests that I am over predicting ice by ~0.4 units.
ps: via the Baron, I see that Curry is still pulling numbers out of her hat instead of doing science. But that is blog science for you: you can just make stuff up and no-one cares. When did Curry change from being a serious scientist into a comic turn?
pps: I'm finding Early Warning interesting reading nowadays. Lots of graphical analysis of oil prices,
I hope the odds of "2011 being 2007" are low, so it might make more sense if it said 'IJIS minimum extent for 2011 being above 2007' ;o)
[Just a minor typo now corrected -W]
Volume purchased at 42.5 appears to be 30, so I am guessing for anyone interested that is US$127.50 William has tied up for a $300 bet ($172.50 potential profit).
"expect there to be summer ice n 2050" is fairly vague - it could mean a tiny bit of ice left on say 1 July which then disappears until Nov.
I get the impression you are saying you expect the extent curve to start leveling off pretty shortly let alone the volume curve. So not much opportunity for the extent curve to accelerate before it starts leveling off, according to your expectations?
[Yes, I was vague, because I didn't bother look up the std predictions. I could have been more precise and said "> x units" but at that point all I was trying to do was make a clear contrast with the "essentially gone by 2020" type. And yes, I don't expect the extent curve to accelerate downwards -W]
About time too... ;-)
Re the graphs. They were quick and dirty, and based on applying 10 and 20 year trends to the last data point -- but I think that's reasonable enough given that I wasn't simply projecting trends, but seeing how the volume loss impacted extent. As you say, the impact of simply projecting the trend doesn't really make much difference.
Where we really differ is in our interpretation of the ice loss in terms of the overall Arctic heat budget. My thesis is straightforward enough: heat loss over winter is effectively fixed -- enough at present to grow a little more than 1 metre of new ice over most of the Arctic ocean and adjoining bits as you say. Thick multi-year ice is a sort of "reservoir of cold", big enough (until relatively recently) to buffer the sea ice extent/area metrics against natural variability. However, we know that the amount of multi-year ice has been declining steeply, and this is reflected in the volume modelling. That demonstrates that there has been a large positive term in the Arctic heat budget for the last 20 years, and it has been increasing in size. It's probably oceanic transport (per Maslowski and others).
When natural variability aka weather is overlaid on top of that, you get the wiggles in the graph, but the trend continues. Volume has to be the key factor, because it tells us about the heat budget. Area and extent are interesting, but they can't help us with heat (they're obviously important for albedo etc).
Unless the amount of heat being shipped north decreases to the point that it is smaller than the heat lost over winter, the volume of ice will not be able to significantly increase. What I hoped to demonstrate was that if you consider volume as the most important factor, there comes a point when area/extent have to collapse, because the idea of an ocean covered with a few million square kilometres of ice only a few centimetres thick is definitely unphysical... ;-) There will be a Grumbine asymptote towards zero ice at minimum, and that might be a fairly long tail, but in practical terms, anything below -- what, 1m km2? -- is going to be to all intents and purposes an open ocean.
Of course, things are now getting complicated because the reduction in summer sea ice, and the later freeze up in autumn is beginning to impact Arctic weather. The heat the Arctic ocean is trying to lose in early winter is making itself felt with unpredictable consequences for the ice itself.
Anyway, in this battle of wits you have one big advantage -- you have at least been a sea ice modeller. Me, I'm just a writer... ;-)
[Yes, that is what I thought you thought. As I attempted (but clearly failed) to explain, I think you are wrong in what you identify as the key factor. I'll probably have to attempt some kind of simplified model to make myself more convincing, which is unlikely to occur soon -W]
Thanks for replies. Can I try to add further clarification?
"in winter, there is "excess cold" available: the ice freezes up, till it is ~1m thick, and then it doesn't grow much more, because of the insulating effect (waves hands for effect). But in summer, melt is ~linear on the warmth available. So there is a sort of stabilising effect."
Not sure about what "linear on the warmth available" means. It seems to concede that albedo effects will increase warmth available and so volume melting each year will increase. Presumably you don't think it will increase by as much as volume frozen increases because you do not expect acceleration in extent curve.
You seem to be saying volume frozen each freeze season will increase as volume decreases.
I know you think volume data is rather suspect but...
Bfraser posted some TOPAZ data over on Neven's blog:
http://neven1.typepad.com/blog/2011/02/breaking-cryosat-ice-data-now-op…
I have calculated extent, area, and volume based on that data (which doesn't including the bering strait, so it is a bit hard for me to verify):
Date Extent Area Volume
05/22/2007 11,505,156 10,452,234 24,155,612 First day, max already passed
09/03/2007 4,313,281 3,306,845 7,350,711 Min volume
02/10/2008 12,007,188 11,620,371 18,152,117
05/07/2008 11,846,094 11,278,633 23,440,719 Max volume
09/11/2008 4,549,063 3,710,142 6,229,119 Min volume
02/10/2009 12,109,688 11,984,098 15,547,165
05/02/2009 12,244,375 11,803,745 19,104,472 Max volume
08/31/2009 4,997,656 3,906,281 5,325,341 Min volume
02/10/2010 11,938,188 11,600,502 14,203,979
04/20/2010 12,216,094 11,668,124 17,928,286 Max volume
09/21/2010 4,442,344 3,924,835 4,302,055 Min volume
02/10/2011 12,073,281 11,808,796 12,834,308 Last day, max not reached
FrankD posted:
The picture from PIOMAS is subtlely different, so for comparison (monthly data)
For recent years, max is always achieved in April, while min is always achieved in September, so Vol(Apr) - Vol(Sep) = Vol (reduction)
2005...25088 - 9938 = 15150
2006...24493 - 9672 = 14821
2007...22805 - 6042 = 16763
2008...23024 - 6126 = 16898
2009...21756 - 5583 = 16173
2010...20793 - 4079 = 16714
If these volume numbers are so suspect, then to me, it seems suprising that there is reasonably close agreement on both the 2010 volume being in the region of 4200 km^3 +/- 100km^3 and the rate of decline being close to 1000km^3 per year.
4200/1000 is only ~4 years and this may not sound like there is much time for the extent curve to level off. However 1000km^3 spread over a maximum area of 13m km^2 can also be interpreted to say it only takes an extra 9cm of ice thickness growth (due to less insulation) to stop the declining volume dead in its tracks and that is only going to kick in at the last moment when the ice gets to be very thin.
The volume melting each year seems to be more than 1m times maximum area of 13m km^2. So perhaps your "till it is ~1m thick" is a bit on the low side? Perhaps you are wanting to emphasize that 0 - 0.5m is really quick while 0.5m to 1.25m is much slower and therefore the extra 9cm thickness growth needed to stop the volume decline is easily achievable as the volume declines further?
The above (wild?) interpretation of what you have written seems to suggest to me that it is quite plausible that 2011 extent will be lower than 2007 but the summer ice just isn't going to disappear soon. (Incidentally, you can now buy another 10 contracts at a lower price: 42 instead of 42.5 so not a dramatic move.)
Anyway, is that a less hand wavy version or a complete misrepresentation of your views?
To convince me, William, you will have to explain why either the negative terms in the overall Arctic heat budget (principally winter cooling) will grow as ice declines (I'm reasonably open to that by the way, but I'm not impressed by crandles' 9cm, especially if the source of the excess heat is oceanic), or suggest why ice volume is not a good metric and/or an important term in that budget.
[Oh, that is easy. The winter cooling will grow as the ice declines because with less ice, there is more open ocean (or more thin ice) so the heat loss to the atmosphere (and thence, to space) increases. This is a strong negative feedback, comparable to the summer albedo one -W]
The Arctic is unlikely to experience sudden loss of sea ice during the twenty-first century, according to Alastair Brown.
[That looks like its just a copy of the paper David Schroeder and I published about 3 years ago, also in GRL. If I was still in research, I'd write them a stiff letter.
Schroeder, D., and W. M. Connolley (2007), Impact of instantaneous sea ice removal in a coupled general circulation model, Geophys. Res. Lett., 34, L14502, doi:10.1029/2007GL030253.
It does look like they cited us though. Clearly they have better PR people, to get a link into Nature -W]
>"This is a strong negative feedback, comparable to the summer albedo one"
Only comparable? My first recation to this is: Doesn't that imply that the volume will approximately continue its ~1000 km^3 per year decline until the ice disappears at its minimum?
On further consideration, perhaps you believe the summer albedo effect is similar in terms of size of heat effects but that the extra heat is badly distributed? I.e. becomes distributed into regions where there isn't much ice left so it cannot melt much ice and most of the extra heat goes into water temperatures which is just lost to space come the following winter.
I don't understand Gareth's "especially if the source of the excess heat is oceanic". Surely the oceanic waters have to be the source of the heat loss, otherwise the water cannot lose the latent heat necessary in order to freeze? W seems to address destination rather than source. (I see nothing contentious in what W writes of space being the destination.) So I am a bit lost on that exchange of views.
Crandles, I think you're missing that Gareth has a lot of the heat entering the Arctic Ocean coming in ocean currents from elsewhere. It's not just the extra heat from summer sunshine penetrating into the now-blue Arctic.
Gareth does seem to be entirely missing the insulating effect of the ice. But it took a long time for William to point that out. I was waving my arms about it way back then (pats self on back). Oh it was in discussion of another of Gareth's posts (about a week later): http://hot-topic.co.nz/gone-for-good-arctic-ocean-ice-free-all-year-by-…
I don't understand Gareth's "especially if the source of the excess heat is oceanic". Surely the oceanic waters have to be the source of the heat loss, otherwise the water cannot lose the latent heat necessary in order to freeze? W seems to address destination rather than source. (I see nothing contentious in what W writes of space being the destination.) So I am a bit lost on that exchange of views.
OK, I see what you're driving at. Your argument is that the total amount of heat loss available over winter is larger than the amount of represented by current ice formation, because once the ice gets thick enough it limits further heat loss.
That's obviously trivially true for the case where the AO sea ice reaches lower minimums -- more open ocean, more heat to lose to the atmosphere and space. That's the effect that is driving the Warm Arctic Cold Continents pattern that seems to be emerging during the last few NH early winters. But the fact that the AO can cool itself enough over winter to cover itself with 1m thick ice is an argument for a delayed onset of ice-free winters, not ice-free summers. Nor do I see how it can act as a powerful stabilising feedback (but then I maybe missing something).
The volume data give us an idea of the overall heat budget, and the steady decline in volume (and multi-year ice) means that at present there's a positive term strong enough to outweigh currently available heat losses. That excess heat has to go somewhere, and over summer after melting ice it will warm the ocean. That heat will then be lost to the atmosphere and space over winter and the absolute amount of autumn/winter heat loss will increase as summer ice cover decreases. But in effect "excess heat" will still be accumulating in the system. That may not express itself as a reduction in "thickness" as I projected in my post, it may mean that larger and larger areas of ocean freeze up later and later (pace Hudson Bay this winter), but it will have an effect. What and when we might argue about... ;-)
The trend amount plus variation is the observed linear trend over the satellite period? I see that's what you had last year also.
I thought at some point you were basically predicting that we would be in line with the model runs from the latest IPCC report. False memory?
[I think I commented that I didn't really believe the claims that the obs (mostly the 2007 obs, really) show that the "real" trend is strongly different from the model trend -W]
I don't understand Gareth's "especially if the source of the excess heat is oceanic".
I was suggesting that if the excess heat that's causing the long term decline (in whatever metric you choose) is primarily oceanic (warmer water arriving from the south), then an increase of 9cm in basal ice thickness seems unlikely (because that's where a good chunk of the melting is happening). Or something. ;-)
Gareth,
So in those circumstances a 1m increase in ice thickness over winter also seems unlikely???
>" I think you're missing that Gareth has a lot of the heat entering the Arctic Ocean coming in ocean currents from elsewhere."
For one thing that seems to me to be part of the existing heat budget, whereas the 9cm is being suggested as a plausible *change* to the heat budget as a result of reduced ice insulation.
Also, losing the heat in temperature of water is trivially easy in winter compared to losing the latent heat necessary to freeze 9cm of thickness let alone compared to losing the latent heat necessary to increase thickness by a meter. Also losing that temperature heat doesn't increase the ice insulation.
The problems I see with the '9cm is not much' argument are:
1. If albedo heat effects are comparable (as W seems to admit) or greater than ice insulation effects then the volume frozen may increase but will continue to be outdone by more melting.
2. There isn't much time left. If the 9cm effect only kicks in after the maximum volume has fallen to a an amount that can be melted in a season, then you get a practically ice free few days before the heat budget gets back into balance.
3. Natural variability. Even if the 9cm does kick in just in time, you might get a typically balanced heat budget with typically some sea ice remaining. An untypical summer might still provide occasional practically ice free days. Taking PIOMAS figures above, a summer that provides 20/17 of normal melt could be enough this year but we haven't seen the 9cm effect kick in yet. By the time such a 9cm effect kicked in, 10% more melt than normal could well be enough and I suggest that is a level that may well occur from time to time based on difference between 2006 and 2007 volume reduction.
If we are into betting. When do you think we will see the first circumnavigation of Greenland by boat?
Is it possible to bet that 2011 minimum sea ice extent will be below that of 2010? That would be a good start for now.
[Not with me I'm afraid. My "prediction" is 5.235 +/- 0.5, and 2010 was 4.9 -W]
Re #13: I agree. The negative feedback will certainly delay a relatively ice-free state, but then we're already seeing it in action, so it doesn't strike me as terribly informative about the timing, other than to say "longer than it would have been otherwise." Given that at its onset the near ice-free condition will occur late in the season, the negative feedback is a strong argument for a fast recovery, but I don't think there's any argument about that.
As has been noted, there's also the matter of how the Hudson/Baffin Bay ice behaved during the polar vortex breakdown, the point being that in that season of little or no insolation the negative feedback took a while to do the job. If that effect grows, we have ourselves a new Arctic climate state.
And growth does seem to be the expectation. These recent results on stratospheric warmings (leading to vortex breakdowns) are pertinent, noting that there is indeed a continuing strong warming trend in the North Atlantic. See also these results regarding the reliability of the models in the Arctic.
Finally, see these results, which I think toss mid-century and later Arctic sea ice projections based on recent trends right into the crapper, especially as it seems clear that the full modeled results are going to look a lot worse.
[But those are results for 2200; I don't think they tell you anything useful about seaice to 2050 -W]
All of the above papers came out in just the last couple of months. We live in interesting times.
So unless something unusual and exciting happens during the spring and summer (as it did in 2007) the ice will follow its usual patterns.
Yes - it's usual pattern is to lose close to 1000 km^3 of ice volume, compared to the year before (on average).
http://www.picsbynick.com/wp-content/uploads/2010/06/ice6.jpg
If you plotted the area/extent and volume of a melting ice cube on a hot summer sidewalk, you would see the volume go down steadily, but the area would hold out pretty well to the very end. Guess which curve would be more useful to predict when the ice cube will be gone ?
The fundamental questions for Arctic sea ice are - why is it losing so much volume every year (large net melt) ? And why would you expect this process to slow down dramatically before the summer sea ice is gone completely ?
[Not with me I'm afraid. My "prediction" is 5.235 +/- 0.5, and 2010 was 4.9 -W]
So if it's below 4.735 I win, and if it's over 5.735 you win (NSIDC September extent number)? I think betting 10 euros on that is pretty safe. :-)
[No. My prediction is that it will be in the range [4.7,5.7] ish. Over 5.7, I lose; under 4.7, I lose. But also, I can't be bothered with10E bets, they aren't worth collecting :-) -W]
[No. My prediction is that it will be in the range [4.7,5.7] ish. Over 5.7, I lose; under 4.7, I lose. But also, I can't be bothered with10E bets, they aren't worth collecting :-) -W]
I'm not willing to bet substantial sums at this point (although the bet seems pretty safe), but out of curiosity: how much would be worth collecting?
[Ah well, that depends. It is probably better to wait until we both have a position that we're confident of, and that have wide gaps between them -W]
Probably William's just jealous of the scale of JA's (very slow) fleecing of those Russian astronomers. Of course there may be some difficulty in collecting on that one as well.
Re that last paper, William, I admit I'm speculating a little re the impact on sea ice in 2050, but if indeed the carbon loss becomes significant by 2030 and the fully-modeled results do make things look worse (seems inevitable given what the missing pieces are), I don't think I'm too far off the reservation.
Re negative feedbacks, there's also the snow cover response to the vortex breakdowns, although I don't know how it compares to the one mentioned above.
These two studies also just appeared, being further bad news about the Arctic:
and
Has the rest of boreal forest fared better? Even if so (for the moment), the speed at which events are moving is alarming.
[OK, but the "problem" with those (as also the permafrost, or the methane ones) is that one thing we know very well is the current GHG concentrations. And those are rising (well, CO2 is, not methane) at about the IPCC rates -W]
As if on command there appears:
William, of course it's early days as yet, but also the fact that things are still on the IPCC track doesn't give me a lot of confidence given the poor characterization of the sources and sinks. Also, as you know, these effects were all predicted even though not well-quantified, the largest question having been about the timing. That they've been detected at however early a stage is not happy news.
Gareth and crandles mentioned the albedo effect, which I think is very important in Arctic summer (since average irradiance is the so brutally high during Arctic summer (higher than irradiance in the tropics)).
I ran some quick calculations (albedo, average irradiance etc) and it seems that some 150k km^2 of open Arctic ocean theoretically accumulates enough extra heat (over a typical Arctic summer) to melt some extra 1000 km^3 of sea ice.
That is a very strong positive feedback, which suggests that possibly there is a sea ice extent graph (running some 400k km^2 below the 2010 line) below which Arctic sea ice volume is in danger of collapse before melt season is over.
I checked these numbers against volume and extent changes over the prior 10 years, and find a consistent trend at some 180k km^2 melting 1000 km^3 of sea ice.
If that's real, then Gareth's projection may even be conservative, extent has non-linear relation with volume, and there may be a quick collapse some summer in the near future....
It seems everyone is re-running your experiment. See also Tietsche et al, "Recovery mechanisms of Arctic summer sea ice", GRL 2011, doi:10.1029/2010GL045698. Would post a link but the AGU site seems to be down at the moment. There's a news article about it by Serreze in this week's Nature.
Silly me, that's the same paper which Brown is writing about. My mistake.
Follow-up on my albedo post from yesterday. My simple albedo model calculations show that IF the 2011 ice extent stays 400k km^2 below the 2010 extent, that Arctic sea ice is in serious danger of total collapse during the melt season.
It currently is 508k km^2 below the 2010 curve (EARC-JAXA)...
Now, a lot can happen before the real Arctic summer kicks in, but nonetheless, this seems very concerning to me....
@Rob
That's very interesting - yes, I've heard that more uncovered ocean will absorb a lot more sunlight than sea ice, but I hadn't seen it quantified like that.
Two points - the amount of heat absorbed by "newly unveiled" ocean area will probably go down as the Marginal Ice Zone approaches the North Pole, just based on the geometry of tilted Earth and the thicker atmosphere for low angle incident sunlight (but I'd have to think about that - it's too late right now...) But the albedo feedback will continue to be an important factor as the sea ice edge approaches the Pole.
And newly exposed ocean is also affected by winds and waves that didn't affect it very much when covered with ice - I've seen some papers suggest that this new mixing brings up heat from below the halocline level faster than before (from the warm, salty water that lies about 50 to 200 meters below the sea ice). Some of this heat diffuses up slowly, even in tranquil water, but wind/wave action changes the dynamics in not well-understood ways - but almost certain to add to the basal melting of sea ice adjacent to this open ocean.
A third, lesser point, is that FYI (first year ice) is darker than MYI (multi year ice), so just the changing fraction of FYI/MYI is having an albedo affect causing more sunlight to be absorbed.
http://soa.arcus.org/sites/soa.arcus.org/files/sessions/2-1-observation…
Another 56 cm of melt over the course of a complete summer melt season, for FYI vs. MYI.
All these things that increase net melt for a year preconditions the Arctic sea ice for the next year, and that final, dramatic collapse, as you say. I figure it will be between 2011 and 2016, but definite dramatic developments by 2013. The heat injected into the melt season depends quite a bit on hard-to-predict things like ocean currents, cloud cover in August, winds in July, etc., so you can't say exactly when things will happen, but we're close...
Thanks Anu.
The Tschudi link is very informative. Indeed it shows albedo changes between FYI and MYI, although not very much (0.48 - 0.66) and mostly because of FYI ice breaking up.
I used albedo 0.66 and so my 400k km^2 critical delta may relate more to ice area than ice extent. Also your 'mixing' remark is interesting and may have effect (not sure which way though, since heat can also mix down).
Regarding insolation in the Marginal Ice Zone as it approaches the North Pole, please remember that having the sun up at 23 deg 24/7 is very powerful. Check this plot out :
http://en.wikipedia.org/wiki/File:InsolationTopOfAtmosphere.png
A typical clear Arctic summer day generates more insolation than a clear day in the tropics. And it only increases the closer you get to the pole, rather than the decrease that you expected.
Either way, it seems that the main factors that determine the 'critical' ice extent line (towards total elimination of summer sea ice this summer) will be weather in the Arctic (especially in spring) and remaining ice volume.
Weather cannot be predicted, so I assumed average weather. For volume, I assumed 3,000 km^3 extra melt by Sep 2011(w.r.t. Sep 2010) to be critical, but PIOMAS seems down, and the TOPAZ numbers that Neven just published are confusing (winter volume seems to decline much faster than summer volume, while no reason for that is apparent).
Also, my 400k km^2 number may be still conservative. Early melt will have a bigger effect than later melt, so the current difference will simply reduce the need for melt later. I really need a 2D model to say more than that though.
For now, I still consider the 400k km^2 curve under the 2010 extent line a 'critical' curve which should result in virtual elimination of remaining sea ice at the end of August....2011. I can hardly believe that I'm even considering this, but I can't find much of error in my calculations.
Either way, it's gonna be a VERY interesting melt season this year !
P.S. I admire your posts on neven1, and will register there shortly. With all respect to William, but it's kind of silent around here...
["Whereof one cannot speak, thereof one must be silent." -W]
Crandles at #13: I think it's feasible that there is "excess cooling" available which will tend to slow down the ice loss as the summer minimum declines, but (waves hands) I have a hard time thinking it's on the same scale as the current excess heat being shipped into the Arctic. If you could find a reason for suggesting that might stop, then I'd be impressed - but it would probably involve a sudden halt to heat accumulation in the tropics...
I think it's far more likely that we will see large part of the AO showing later and later freeze-ups, and that this will mean (eventually, even if there is an "excess cooling" term in the heat balance) thinner ice going into the spring melt. And so on, repeat until gone.
>"I think it's feasible that there is "excess cooling" available which will tend to slow down the ice loss as the summer minimum declines, but (waves hands) I have a hard time thinking it's on the same scale as the current excess heat being shipped into the Arctic. If you could find a reason for suggesting that might stop, then I'd be impressed - but it would probably involve a sudden halt to heat accumulation in the tropics..."
I also have a hard time thinking it's on the same scale as I tried to say before one is a change to the heat budget and one is part of existing budget. So to put into similar terms you have to think not of 'excess heat being shipped' but of *change in rate* of 'excess heat being shipped'. Yes I think the rate is increasing but have you shown that the rate of increase is rapid rather than slowing increasing to current level over last 40 years?
I think it is a matter of projecting like this:
http://www.flickr.com/photos/37346653@N05/5501725499/
The steep curl slopes are calculated as best fit on last five years data. To avoid inappropriate downstep new slope is only shown on curl freeze line when it exceeds prediction of old shallow slope.
I expect a curl rather than two straight lines but the slopes of the upward curls are rather uncertain. My guess, and it is little more than that is that the upward curl on melt will keep the volume melted well above volume frozen.
William doesn't need to find a reason for suggesting why current excess heat being shipped into the Arctic will stop that could continue at similar to current rates if he can find a reason for why the slope of the melt trend won't
curl up as much as the freeze trend will.
Rob,
Re your insolation graph.
1) This is at TOA, i.e. ignores the depth of the atmospheric column, with the sun at max 23deg, the atmospheric depth is a key player.
2) Maximum TOA insolation is at 21 June. By the time you get to September the insolation is far lower, as is the angle of incidence.
I think that this may explain why in 2007 the melt didn't proceed all the way to the pole. I'm awaiting another crash to see if the same thing happens. Although it must be noted that we've had 3 minima after 2007 that didn't reach the polar area, despite having areas of the same order as 2007. 2007 was due to an atypical assertion of the Arctic Dipole. i.e. was not under typical Arctic weather.
We've already seen the virtual removal of multi-year ice from the Arctic, yet it took an unusual weather event to cause a crash in the Arctic ice. Conditions are still such that first-year ice in excess of 1 metre is easily able to grow throughout most of the Arctic basin. So I think the region needs more time to warm and greater winter downwelling OLR (more due to water vapour & clouds than CO2/CH4). I think that in the decade 2020-2030 we'll see a virtualy ice-free Arctic (less than 1 million km^2 off N Greenland and the Canadian Arctic Archipelago). If I'm wrong I expect to be calling it too early.
Crandles: William doesn't need to find a reason for suggesting why current excess heat being shipped into the Arctic will stop that could continue at similar to current rates if he can find a reason for why the slope of the melt trend won't curl up as much as the freeze trend will.
OK, so why might the melt slow down? It's pretty clear that as minimums get smaller both the annual melt and freeze will increase. The Arctic will become more like the Antarctic for a while (which perhaps explains William's thinking, as a BAS person), but you can't escape the accumulation of heat in the system.
Gareth, if the only feedbacks were albedo and ice insulation or other feedbacks were tiny compared to these then we could say we see albedo feedback seems greater than the ice insulation and there doesn't appear any reason for that to change.
There remains the possibility of other feedbacks that have different timing for their impacts. Snow cover has several effects, it is more reflective than ice but also has more insulating effects than ice. Perhaps these cancel sufficiently to leave the net effect too small to make a significant difference. I think it is hard to rule the possibility of more negative feedback mechanisms that have noticable effects.
With other feedbacks kicking in at different times, the slopes of the two steep lines going forward in
http://www.flickr.com/photos/37346653@N05/5501725499/
could well be significantly different to the last five year trends shown. If those two lines cross then 'the accumulation of heat in the system' which you say cannot be escaped would largely disappear reducing to a slow drip effect as more CO2 is added to the atmosphere.
I think the possibility of those lines crossing is small but is hard to rule out unless you know all the feedbacks and are sure they are all at least an order of magnitude smaller than albedo and ice insulation effects. The past is not necessarily a guide to the future if the rules of the game are changing as they are with things like thinner ice means less insulation and less ability to support snow cover etc. Perhaps others who are more knowledge would find it easier to say all the other feedbacks are small.
I would like to know why William might think this is likely rather than just a prayer to the god of the gaps.
@ChrisR, thanks for your note.
I posted the insolation graph only to show that above the Arctic circle, insolation increases the closer you get to the North Pole.
Regarding the 2007 melt season, it become apparent that melt (and extrusion) of ice was vigorous and widespread. When you look at the PIOMAS ice volume numbers, you'll see that 2007 knocked out some 6,000 km^3 extra ice out of the Arctic compared to the prior year. Probably the only reason that ice did not collapse all the way is that there was simply still a lot of multi year ice around. This time, there is no such buffer. Remember there was only 4,000 km^3 left over last September. With the already record low ice extent numbers in Feb now, helped by (positive feedback) albedo factors, we should seriously consider that an average or slightly warmer than average 2011 Arctic summer can easily knock out the remaining ice, and give us an ice free North Pole, probably for the first time since the start of the Holocene...
@William : I know you have taken an increadible amount of flak from climate science deniers over the past few years, and I admire your resilience in standing up for science all though that period, while every word you wrote was put through the meatgrinder.
In that regard, I understand completely that you would be more conservative in your statements, and that you would not want to state anything that the IPCC has not ratified.
However, it seems that the most agressive scientific estimates (from Prof. Maslowski; ice free Arctic by 2016 +/- 3 years) now are actually a very real possibility.
[No, I think that is vanishingly improbable. I've been saying that for a while now (see http://scienceblogs.com/stoat/2008/11/another_trail_of_twaddle.php).
Imagine for a moment that the North Pole would be ice free by 2011, 12 or 13, or the whole Arctic ice free by 2016. After 2007, everyone got wildly over-excited about the prospect of sea ice melt. 2008/9/10 dampened that enthusiasm a bit, but it still waits to break out and needs to be squashed.
I don't, for example, see anyone here prepared to put money on a record low this year... or next year... or the year after. Which gets you most of the way to 2016, when most of the ice is supposed to have vanished -W]
Knowing that this would be some 20 years or so ahead of IPCC schedule, and knowing that an ice free North Pole (let alone Arctic) could create a tremendous 'emotional' shock through society, I wonder if you have an opinion on if the scientific community is prepared for the questions that will come our way once that majestic event occurs. Like :
[IPCC "predicts" summer ice all the way to 2100 (http://www.ipcc.ch/publications_and_data/ar4/wg1/en/figure-10-13.html) so the change you're looking for would be far more than 20 years ahead of schedule. Just open water at the North Pole would be less exciting -W]
* Is this a single-year 'fluke' event or something more structural and permanent ?
* In how far are we humans responsible for this melting of the North Pole ?
* When was the last time this happened ?
* Why is it not 'natural' this time ?
* How does this change the weather patterns in the Northern Hemisphere ?
* How could the IPCC be so far off in their estimate ?
* Which other IPCC estimates are likely to be too conservative ?
* Will winter ice disappear too ? And if so, how fast ?
* How are the Polar Bears and Arctic wildlife affected by this ?
* How is shipping and Arctic development affected ?
* What is the risk of methane clathrates melting now that the Arctic can warm freely without ice ?
* How is Greenland ice sheet affected by ice free Arctic ?
* What should we do to stop this ?
etc etc.
Do you think the scientific community is prepared for this barrage of questions, after the first ice free North Pole in history ? Are the answers realy ?
And as a side-note, since climate science denial industry is already hedging their bets against an ice free Arctic event ("this is natural" and "ice will return") I wonder what the best response would be from the scientific community to politics and the public alike, if we are serious that Arctic melt is AGW related....
Sorry William for the long post. But I would appreciate any comment from you. After all, a first time ice free Arctic may be very, very near...
[I think most of your questions are predicated on the occurence of a very unlikely event. So my response, were it to occur, would be that we would need to re-evaluate a lot of stuff, which would have been shown to be wrong. But I doubt that will happen -W]
William says: "I don't, for example, see anyone here prepared to put money on a record low this year... or next year... or the year after."
Oh, I'd be willing to bet 50 euros on a record low within the next three melting seasons. And with record low I mean absolute daily minimum extent based on data as reported by IJIS. I believe conditions don't even have to be the same as in 2007 for a new record, as we saw last year.
[In principle this looks like a reasonable bet, and we disagree enough to make it worth doing. I need to look at the odds carefully to see if I'll be happy. I'll do a new posting on it. Nudge me if I haven't in a week -W]
"I don't, for example, see anyone here prepared to put money on a record low this year... or next year... or the year after."
How many are prepared to bet *against* it? It seems to me that many (like me) aren't prepared to bet one way or the other. But I could be wrong, obviously.
[I will. Post coming in a bit, see reply to Neven -W]
Additional question for William. In my calculations for albedo effect, I used a graph from Wikipedia :
http://en.wikipedia.org/wiki/File:Insolation.png
which was generated by you :o) Thank you !
It shows around 100 W/m^2 insolation on yearly average in the Arctic, and you mention HadCM3 data as the source.
Question for you : where can I obtain that data in a (preferably gridded) form, and what sources are used to create this data ? Is that 100 W/m^2 "on the ground" insolation real and compensating for cloud cover and such ?
[That is climate model data; I no longer have easy access to it. You could perhaps pull the equivalent out of the IPCC archive, or maybe use one of the various online tools that will query the archive for you. Note that you can't use the annual average value for anything useful -W]
William, sorry if you've already given your view on this, but what do you think of PIOMAS?
Thanks William, for your perspective on ice free Arctic summers. I hope you are right.
One note : you write "Just open water at the North Pole would be less exciting" but I suspect that for the public an ice free North Pole will be immensely impressive. Santa's home gone, and boats can simply sail over the pole.
That's gotta have a bigger emotional impact (and generate the questions I posted above) than an 'ice free' Arctic, which is much less clearly defined any way.
Regarding the insolation numbers from HadCM3, the model data is actually consistent with measurements. I tracked down insolation numbers from ISCCP-D observations and the monthly 'shortwave downwelling flux' integrated over the year (summer mostly) turns out to be some 3.0 GJ/m^2 for much of the Arctic basin. This is 95 W/m^2 based on monthly average. So your insolation graph on wiki is perfectly valid, and HadCM3's insolation numbers are accurate too.
However, this also means that my albedo calculations still stand. If ice extent remains at least 400k km^2 smaller than last year through spring, then with average weather in summer, the albedo change is enough to melt virtually all remaining sea ice by the end of August. Including creating an ice free North Pole.
We are now at 540k km^2 below last year this day (when particularly cold weather started to increase extent significantly, to the point where WUWT was claiming 'recovery' to the mean). No such 'recovery' in sight this year, just average weather, and the ice is thinner than last year....
Are you sure that an ice free Arctic very, very soon is stil "a very unlikely event" ?
Rob, it's worth remembering that extent at this time of year is not a good predictor of summer melt, because the ice that's currently forming/melting is outside the Arctic basin.
Crandles: I guess we'll have to wait for William's simple model to see what he's on about... ;-)
You are right Gareth. The real party does not start until the Arctic basin starts breaking up, which will probably not happen until May. Still, the real concern that everyone has (and that you expressed in your post as well) is the ice volume that is waiting there. If PIOMAS or TOPAZ is even remotely correct, then ice in the basin is significantly more fragile (thin) than even last year, and a lot just a few years ago. The winter was also very mild, so with just a bit of 2007-like summer and common sense and some simple physics would suggest that the Arctic basin would clear out before September.
However, ice extent and area do not show significant trends since 2007, the only thing that is really scary is these volume numbers, and their steep downward trend. The big question thus is : can we trust these volume numbers (from PIOMAS or TOPAZ) and their trends ?
Is the ice really as thin as these models suggest ?
Not sure if anyone is still reading this, but there I found something that is somewhat disturbing and at the same time very obvious.
I think it was Trenberth who asserted that currently our GHG emissions cause a radiative forcing across the top of atmosphere, essentially reducing our planet's cooling, by some 1 W/m^2. On most of the planet, that heat flux goes into warming the oceans, causing the planet to warm up, as witnessed by multiple observations.
However, in the Arctic, that heat cannot go anywhere. It's the coldest spot around, so it cannot offload heat to another place, and it's ocean is covered with ice so it perpetually at close to 0 C. So the heat can only go into melting sea ice.
The Arctic covered by sea ice is some 1.5 E 13 m^2 in size. With 1 W/m^2 forcing, this means that the Arctic accumulates some 4.7 E 20 Joule of heat per year that has no place to go. That is enough heat to melt some 1400 Gton (km^3) of sea ice, every year.
[I don't think that view of the radiative balance works. It isn't just a simple adding 1 W/m2 flux; there are huge seasonal and daily variations. I don' think your picture of the other bits of the planet dumping heat into the Arctic works, either (well, except in the sense that there is a net heat flow from tropics to poles, of course, and that will get a teensy bit bigger -W]
Incidentally, if we look at the PIOMAS ice volume numbers, we see a reduction of volume of indeed some 1500 km^3 per year. Look at volume numbers per month, as they reduce year after year :
http://snipt.org/wnoP
(courtecy of FrankD posted at Neven's Arctic blog)
So it seems that Arctic sea ice volume reduction is very easily explained by our GHG emissions, and the reduction in radiation from the Arctic that this has caused.
Please tell me where I made a mistake, because if this is correct, then we have less than 3 years to see an ice-free Arctic ocean in summer.
Even worse, it is a-priori unclear when the equilibrium will be restored, since every year the Arctic still accumulates 5E20 Joule more heat.
[As I've already said: I don't think extrapolating the volume numbers forwards makes any physical sense -W]
Thanks William, but I'm not extrapolation the volume numbers. I'm simply attributing volume numbers to radiative forcing numbers.
In addition, if other bits of the planet are dumping heat into the Arctic as you suggest, then the melting of sea ice would go even faster than it is observed to do. Also, please note that the PIOMAS numbers suggest that reduction in sea ice volume is mostly caused by a reduction in ice accumulation during the winter (freezing) season, and not so much during the melting season (which stays unchanged at some 15,000 km^3 ice loss from April to September).
Reduced ice accumulation during winter is consistent with the notion of reduced radiative cooling during the dark Arctic winter...
[In principle this looks like a reasonable bet, and we disagree enough to make it worth doing. I need to look at the odds carefully to see if I'll be happy. I'll do a new posting on it. Nudge me if I haven't in a week -W]
I would have nudged you before, but SB was inaccessible to me until now.
So: Nudge. :-)