
Every now and again I remember to look at this year's sea ice, and it is as depressing as looking at the share prices :-(
2011 is already #3, and will almost inevitably make #2, though probably not #1.
Refs
* Betting on sea ice: $10,000
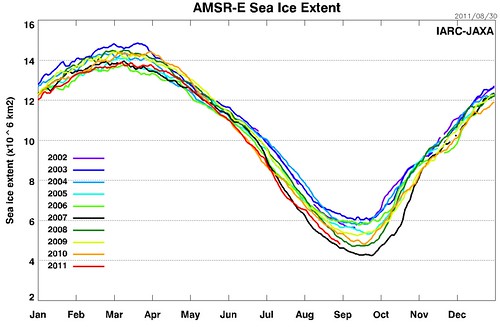
* This year's sea ice
* Around Bee Rescue, Honey and Rancor
* RMG
* Arctic.io
* Neven
2011 is already #3, and will almost inevitably make #2, though probably not #1.
Quite true. However, 2011 is gaining ground on 2007, and is less unlikely to beat that record than it was a couple of weeks ago.
The daily minimum for 2007 was 4.25 million km2. As of today, it's 4.80. If 2011 declines at the decadal average rate for this part of the season, it would end up at 4.5. If it declines at the average rate of the four most recent years, it would end up at 4.4. If it declines at last year's rate, it would end up at ... 4.26. Talk about a nailbiter!
Today's drop (99K km2) broke the IJIS record for largest single-day decline this late in the season.
So ... my guess is that it will end up around 4.5, and I agree that it's unlikely to beat 2007. But there seems to be a trend towards larger drops at the end of the season, and if that trend continues this year, it will be a very close race between 2007 and 2011.
William, I forgot how our bet went. I bet 50 EUR with you that there would be a new record minimum SIE in both IJIS (daily) and NSIDC (monthly) datasets in either 2011, 2012 or 2013, right?
This year probably won't make it, but it's close, despite some very adverse weather that was never there in 2007.
If the few snippets of news regarding ice thickness are true, PIOMAS volume is probably going to hit a new bottom. It's just a matter of time before area/extent catch up.
[I can't find our bet either, immeadiately, but I'm sure we will if we need it. Your version sounds correct -W]
Just by looking at the numbers you'll drop the true nature of the current ice pack. The average concentration is way lower than in 2007 and the regions with very low concentration are exposed differently to even warmer surface water. Look at the concentration maps here:
http://www.arctic.io/sea-ice-charts/
and see Swiss cheese melts faster.
[Trolling removed -W]
Why don't you show the real sea ice extent graph?
[It is certainly different. What makes it real? -W]
That's pretty funny, tfp. Those guys are partying like it's 1998.
Right, Eli, but everyone uses JAXA's larger aperture AMSR data because they release daily numbers (2-day smoothed, albeit) and UBremen doesn't.
But speaking of JAXA, the numbers show that things are in fact pretty tight. Following yesterday's record loss, if 2011 posts two more days equal to today's 59k figure it'll be less than 2k behind 2007, i.e. in a virtual tie. It's a horse race.
But who cares about that? :) Seriously, the important story seems to be that 2011 is doing largely with melt what 2007 did largely with compaction. The current state of the ice is quite sad.
Oops, forgot to conclude:
And so the Stoat's "probably not #1" seems to be somewhat wishful thinking, considering that 2011 should have every advantage coming out a near-tie situation in two days.
A comparison of 8/31 UBremen extent in 2007 and 2011 is instructive. The latter has a lot more low-concentration ice at lower latitudes.
Julienne Stroeve said over at WTF:
"How the #s stack up for August 30th (actual daily values, not the 5-day running mean).
"In my opinion, given the uncertainty in these #s, 2007 and 2011 are tied at the moment.
"2007 2008 2009 2010 2011
4.58865.078775.336695.212154.65878"
So apparently 70k is already within the error bars as far as she's concerned.
[That is probably correct; the "true" value, whatever that might be, isn't known to the degree of precision we're trying to see -W]
The same thing that make IJ real
For bunnies wanting a less cryptic answer, NSIDC uses a 25km grid, JAXA uses a 12.5km grid an Uni Bremen uses 6.25km grid. I would suggest that makes Uni Bremen data better but unfortunately the actual numbers are not available yet.
I doubt you would want to change for this year but if the numbers become available, would you be willing to swap to Uni Bremen figures for future years in place of NSIDC which I think we specified?
Previous bets at http://scienceblogs.com/stoat/2011/06/betting_on_sea_ice_10000.php#comm…
Hmm. Not sure how swapping to Uni Bremen would change the thresholds - probably more arguing over how to adjust them than it is worth. But still for future bets, I suggest Uni Bremen should be preferred based on better accuracy from small grid size.
[I think I'd rather not. I don't have anything against them, but I'm dubious about fiddling about the small details and spurious over-accuracy -W]
The other source our bets use is NSIDC. While daily NSIDC extent numbers are not available, a graph is and is at
http://nsidc.org/data/seaice_index/images/daily_images/N_stddev_timeser…
A narrow lead for 2007 but that hasn't started the relevant month yet due to 5 day averaging.
You have to show that the accuracy is spurious AND overdone, W.
The "small details" claim is acceptable, but mostly since the bet was made on the baseline from one dataset, it would behoove you to use the same dataset to decide the outcome for the bet.
For deciding whether you have a minimum extent IN REALITY, and not for the purposes of a bet done beforehand, you would want to use the more accurate measure.
Myron Ebell sez data shows stability and ice should recover in a couple of years, so rest easy.
Maybe a betting opportunity, but I think he ran away from a bet with James, so that's doubtful.
Whoa, hold on there, everyone. There's a lot more to accuracy than just the grid cell size. It's entirely possible that institution A reports sea ice extent on a finer grid spacing, but institution B uses an algorithm that more accurately handles mixed water/ice pixels.
It would be interesting to do a comparison of the accuracy of estimates from NSIDC, IJIS, and Bremen. But that comparison should be a bit more sophisticated than just saying "25 > 12.5 > 6.25, so IJIS is better than NSIDC and Bremen is better than IJIS"!
[Yes, very much agreed. And there is the interpolation issue. And I have a strong feeling there are two grids anyway (different polarisations?), but I've now forgotten all the details -W]
The comparison between them is an estimate of how much the ice is broken up.
"But that comparison should be a bit more sophisticated than just saying "25 > 12.5 > 6.25, so IJIS is better than NSIDC and Bremen is better than IJIS"!"
At a first order, you don't have to do as much work to correct for ice/sea mixing in a broken floe if you're using a smaller grid.
So you'll have to do better than just say "it's more complicated than that!", you'll need to show that the doubled or quadrupled accuracy is less than the accuracy introduced by the algorithms used in the coarser sensor.
Wow,
"you'll need to show that the doubled or quadrupled accuracy"
I can't see that anyone here has demonstrated or linked to a demonstration that accuracy in this case increases as a linear function of decreasing linear grid dimensions. Feel free to do so but don't expect anyone here to accept this relationship based on proof by assertion.
[Deleted. Be polite -W]
Wow writes: It's junior school maths. If you want "convincing", then ask anyone who does interpolation or subsampling on images.
[Well, he did, but I deleted it as impolite -W]
That's not the hard part of remote sensing. The hard part is the model to go from the raw AMSR-E measurements to calculated fractional ice area within each pixel. If IJIS-JAXA and Bremen used exactly the same algorithm, then yes in principle the one with the finer output grid resolution would be more accurate. Without doing any research whatsoever, though, I'd speculate that they aren't using exactly the same methods. In that case, differences in the methodology would probably outweigh the differences in grid spacing, when assessing the relative accuracy of the two.
What's impolite about saying "it's simple maths"?
[Lack of respect for fellow commentators. If the issue looks to you to be as simple as simple maths, then the chances are that you've misunderstood. So, it is best to ask for clarification. If it really is a simple maths error, point that out politely -W]
[Snips -W]
As I said before: you're getting a doubling or quadrupling of accuracy by using a smaller pixel.
[Yes. You said that before, and it isn't really correct. What is wrong with it isn't trivial to explain; I'd need to look it up, remember it, or make it up. If you're reduced to just repeating what you've said before, ask yourself: why bother? -W]
[Snips -W]
Wow,
"If you're halving the linear dimension of your pixel, you're twice as accurate at working out what's in the pixel..."
That statement appears to be based on an assumption that there are no sources of inaccuracy in the computation that don't vary in inverse proportional to pixel size. I don't think that assumption is valid. If the task was determining how much of a uniformly white surface part of which had been painted black was each colour and each grid cell had to be classified as either 100% black or 100% white you might well be right but, as others have observed, passive microwave sensing of sea ice concentration and turning that concentration data into extent numbers is more complicated than that.
There are many cases in remote sensing where a two- or four-fold difference in spatial resolution is quite trivial in its impact on accuracy, compared to differences in the methods used.
Look, I'm not asserting that NSIDC or IJIS-JAXA's numbers are more accurate than Bremen's. I have no idea which are the most accurate. There's just a dangerous tendency to seize upon the data source that best confirms one's own expectations, and then come up with reasons to explain why that data source is the best.
Well taken, you have to look at all of them, and it helps to also look at the various maps. What Eli likes about cryosphere and Bremen are the real time and past maps in an easily accessible form. JAXA and NSIC don't seem to have that.
Re "There's a lot more to accuracy than just the grid cell size." &
"There are many cases in remote sensing where a two- or four-fold difference in spatial resolution is quite trivial in its impact on accuracy, compared to differences in the methods used."
I accept both of these (though just because there are many cases does not necessarily mean it applies to this case). Certainly while Bremen are not making their numbers available, it may be that they haven't done as much validation as they would like and the other product may well be more accurate. I only suggest a change after the numbers were published and at that stage is there any reason to believe the Bremen algorithm would be inferior? My response to this would be why would Bremen make a data series if they thought is was going to be inferior? It is of course possible that it will become better over time.
To attempt to judge whether one algorithm is likely to be better than another would require a lot more information. I doubt the following posted by Ned Ward at Neven blog is sufficient to make speculation but maybe the followup might help.
"Uni Bremen distributes a sea ice extent product but does not currently provide a simple online table of daily SIE values. Their analysis is based on the AMSR-E passive microwave radiometer, one of the instruments on Aqua. They map SIE on a 6.25 km grid.
IJIS-JAXA also has a SIE product derived from AMSR-E (it's a joint US/Japanese project, IIRC) mapped at 12.5 km and posted on the IJIS website. This is what most people refer to because the processed results are readily available.
The advantage of these products is that AMSR-E is a very good sensor, but unfortunately the data only go back to the launch of Aqua in mid-2002.
Meanwhile, NSIDC distributes several different SIE data products. The "NSIDC" graphs that people usually look at on the web are from their Sea Ice Index product, which is based solely on passive microwave radiometer data from SSMI, which has been carried by a bunch of DMSP satellites for many years. These are coarser resolution and less reliable than AMSR-E, but they give a much longer historical record. Because of the worse signal-to-noise ratio, they use a 5-day averaging process in preparing the data for the graphs on the web. They post the monthly data -- this is what SEARCH is trying to predict -- but do not post the daily numbers, not even in the five-day-averaged format.
There actually seem to be two different SSMI derived ice extent products at NSIDC -- one based on a local algorithm ("bootstrap") and one that they inherited from researchers at Goddard (the "NASA Team" data set). Historical daily data for these can be found from the 1970s through 2004 or 2007 on the NSIDC FTP site. At the moment I can't recall which one, if either, is equivalent to the data now shown as "Sea Ice Index" on their website.
The MASIE product is a completely different SIE product from the other ones distributed at NSIDC. It's based on the National Ice Center's Interactive Multisensor Snow and Ice Mapping System (IMS). Instead of using just SSMI microwave radiometer data, IMS (and thus MASIE) combine data from a whole bunch of different types of sensors (optical sensors on GOES and AVHRR, microwave radiometers, and I don't know what else).
This is all terribly confusing. If nobody else has a better explanation, maybe over the weekend I'll try to put together a systematic compare-and-contrast of all the various SIE data providers."
[It gets worse, if you actually look at the data from which the various algorithms derive their results, in attempting to tell ice from open water -W]
""There are many cases in remote sensing where a two- or four-fold difference in spatial resolution is quite trivial in its impact on accuracy, compared to differences in the methods used."
I accept both of these (though just because there are many cases does not necessarily mean it applies to this case)."
As do I.
HOWEVER, how complicated are you going to have to get to have a situation where the order in accuracy is different from the order of better resolution?
And, as you pointed out, candles, NONE of those going "it's more complicated than that" have shown that the processing is any less accurate. Given no information, it's more likely to have MORE accurate processing since we, hopefully, learn as we go on and have, moreover, better instruments and computational power to deal with such corrections.
"It's not as simple as that" is more likely to mean "It's even more accurate than that", but only the obverse one seems to be considered.
[Sometime this conversation has to end. If you have new information, or insightful new analysis, then please add it -W]
[You should now regard yourself as on probation -W]
Something someone at RC spotted.
Russian, U.S. scientists set to study methane release in Arctic
"...on short notice..."?
"...following the discovery of a dramatic increase in the leakage of methane gas from the seabed in the eastern part of the Arctic..."?
Could be "interesting".
[Yes, I'd say. The article offers few clues, and "massive" is a vague word -W]
It must be pretty "massive", because 2010 also saw an announcement of "massive" methane release in the same area. I think 2009, too. They're headed for the... "Laptev Sea, the East Siberian Sea and the Russian part of the Chukotsk Sea, where 90% of underwater permafrost is located.".
Miscellaneous notes:
* Both the bootstrap and Team algorithm come from NASA. Bootstrap is Joey Comiso's, Team is Don Cavalieri and others.
* Resolution of grids says little about the data, and vice versa.
SSMI has footprints ranging from 50 km to 12.5 (approx in both cases) depending on the frequency of the channel (19 and 85 GHz on the endoints). AMSRE ranges from 50 km to 6.25 (again approx) for 6.x GHz to 89 GHz.
[Aha, that is the bit I forgot: yes, it is freq-dep, not polarisation-dep (I didn't really believe the polarisation-dep bit when I wrote it, but I knew there was something -W]
If your ice concentration algorithm uses the 19 GHz SSMI channel, as Team and bootstrap do, then there is a degree to which it is inaccurate to say it's a 25 km, or 12.5 km, analysis. That channel is smearing across 50 km.
In AMSR algorithms, similar channels are used to the SSMI, which gives it double the resolution. Still, that means that any algorithm using the 19ish GHz channel has a 25 km footprint. If and only if you use only the 89 GHz channel are you working with a 6.25 km footprint. But the 89 GHz channel is picking up more weather contamination, so either you do aggressive things about filtering the data, rejecting it in suspiscion of contamination, and thence have relatively incomplete coverage, or you accept a degraded accuracy in the concentrations for your benefit of finer gridding.
One can extend this some. Given that there are ca. 14 passes per day near the north pole, you can still get a fairly well-filled grid even at, say, 2 km gridding. Then interpolate across your observation gaps (at least those smaller than, say, 25 km). Would you consider this a true 2 km analysis of ice concentration?
Having mentioned it, I now wonder if anybody is interested in seeing such a grid? It wouldn't be until after I get back from Alaska, but if there's interest, I might stay late at work one day and make up a really high resolution -- mention how fine a grid you want -- AMSRE analysis (using Team2 algorithm).
Re 30/31: The expedition itself being long-planned, I suspect that the short notice refers to the departure date, which probably depended in turn on the ice reaching a certain state of retreat. They need open water for drilling and probably many of their obs.
AIUI, this is the second year of a much-expanded campaign funded primarily by the NSF. Semilitov and Shakhova had been working on this for some years with a relatively low level of support, and when they had finally gathered enough data to show the presence of a considerable climate threat, the NSF funded Samantha Joye and Ira Liefer (and various colleagues) to join in. Semilitov remains the titular leader, but Joye and Liefer seem to be the two big names in methane-in-water.
See this Shakhova slide presentation from last fall. Scary stuff.
Notwithstanding that one of the slides refers to a Liefer et al. paper in process, at this point it seems possible that they've decided to wait until they can get in another season of obs. Interesting.
A bit more on the exepdition.
"This has become the first expedition dedicated to revealing the scale of methane emissions and accompanying processes. We assume, even though this needs to be clarified, that this results from the degradation of underwater permafrost which is no longer acting as a shell preventing methane from penetrating into the atmosphere from deep gas hydrate springs," Igor Semiletov says."
It seems clear enough that there's a monumental amount of mobilizable methane up there, but the big question that needs to be answered is why it didn't go anywhere during the Eemian, when deposits would have been nearly as large as at present. I wonder about currents that may be warmer under GHG forcing than under Milankovitch forcing, noting that Maslowski has stated that the main reason for the (relative) GCM failure on the ice is the failure to account for such warmth.
[Don't forget that moderation is on for all comments, BTW. If you do doubles don't worry, I'll just ignore the second -W]
Back to the sea ice, I just saw this (clunky verbiage due to translation), which seems to confirm amateur impressions in several different regards:
The summer sea ice covering the Arctic is likely to decline this year to a record level of 2007 or possibly even below. Prof. Dr. Rüdiger Gerdes, sea ice physicist at the Alfred Wegener Institute for Polar and Marine Research in the Helmholtz Association, said on Monday during an Arctic Workshop in Bremen, all signs indicate that a very low September minimum.
"If we look at the current satellite maps, it becomes clear how much ice will thaw until mid-month. The ice cap is currently at the edges so much broken that the sunlight can heat the upper layer of water and consequently many floes melt," says Rüdiger Gerdes.
From a photo finish speaks Prof. Dr. Lars Kaleschke, a scientist at the University of Hamburg campus climate. "Our forecast suggests a statistical basis to indicate a loss of ice almost as large as in 2007, only to distribute the ice this year physically different," says Lars Kaleschke. Thus, there exists in this summer strikingly large ice-free areas within the pack ice zone, for example, in the Laptev Sea in northern Russia (see graph: middle). "This hole gives the impression that the ice melted from the bottom here. It did at the beginning of August, was growing and now has reached the size of Holland," said Lars Kaleschke.
Two factors appear to play an important role in this summer to play. On the one reported by scientists from the Alfred Wegener Institute, who were recently on board the research icebreaker Polarstern penetrated to the North Pole, from a very low thickness of sea ice. Measurements had shown an average of 90 centimeters. For comparison: In 2001 the sea ice thickness had amounted to an average of two meters. On the other hand, there is a steady transport of sea ice in the Arctic Ocean ice-free regions. "There the water temperatures due to the radiation and absorption are high, so that ice floes that drift in this region, melting fast," explains Rüdiger Gerdes.
Whether this year's sea ice minimum at the end is indeed lower than the record level of 2007, will be decided only at the end of the month. Four years ago, the previous Record low was reached. The ice extent was then dropped on an area of ââ4.3 million square kilometers.
[Yeees, it is clearly getting very close this year. I may need a rethink -W]
NSIDC Sept 6th update is at https://sites.google.com/site/arcticseaicegraphs/
It mentions
"Higher-resolution Advanced Microwave Scanning Radiometer-Earth Observing System (AMSR-E) data processed by the University of Bremen showed ice extent on September 5 as falling below the same date in 2007."
(but I don't think that means NSIDC thinks the higher resolution makes it more accurate.)
PIOMAS and Cryosphere today have published numbers showing new record lows for volume and area.
Well they are probably just statistical ties:
PIOMAS 31 Aug 11 4.275 vs 2010 min of 4.428
CT 6 Sep 11 2.917 vs 2.919 for 7 Sep 07
Extent may or may not possibly depending whether predicted low pressure actually appears and significantly reduces extent. By time it arrives, maybe it may just push bits of ice around and leave the bits unmelted or maybe there will be an artificial reduction as ice gets wet and a significant amount will reappear again once it dries. Or maybe it will melt sufficient extent. Whatever does happen, it looks close.
[Still a way to go before it beats 2007, according to IJIS -W]
William, you got lucky this time, saved by the weather bell. IJIS and NSIDC will not set new record lows, according to me. :-)
Here I explain why you were lucky: Final Score: 2011 vs 2007
Better luck next year, especially if something doesn't change in ice volume. Or else three times lucky in 2013. Remember, I have these people on my side.
The bet continues...
[It is a touch early to call the minimum, though you are likely to be right. I'll wait a day or two -W]
It is a touch early to call the minimum
It isn't if you look at the weather forecast maps.
NSIDC has also called the minimum.
Well I don't think there is any need to wait any further now. Not this year for our bet (same as Neven's terms) but still two more years....
Bill Frazer has posted
"The volume minima for the sea ice in the Central Basin (per Topaz) in the last five years has been 5.016, 5.042, 4.366, 3.795, and 2.757. Quite a decline!"
I doubt PIOMAS shows such a large loss; loss is under 0.4 k km^3 in total at 31 Aug.
It will thicken up in winter to almost same thickness as last year but a larger proportion of the thickness will be first year ice and melting of this ice can occur at lower temperatures so for a greater proportion of melt season.
It will be interesting to see if winter area and volume were unusually low at the start of this year and manages some recovery or was that the new norm. If the volume stays below 2010 at the maximum, then I wouldn't think you have much chance at all of winning any of our bets. 4.294, 4.119 and 3.94 for 3 year averages starting with 2012 are not far below this years levels and this year does not feel to have been exceptional like 2007 and perhaps not even above average for melt/advection conditions.
> why it didn't go anywhere during the Eemian
More may have dissolved into the ocean -- slower rate of change, less opportunity for bubbles to get to the surface. Just a guess. As I recall the methane and CO2 clathrates are not ancient fossils, but rather a dynamic layer -- bottom and top defined by the temperature of the location. Heat penetrating down changes all that.
NSIDC data is out 4.61 for extent and 2.89 for area. Report at http://nsidc.org/arcticseaicenews/index.html
Probably not very interesting but my verification on my estimates is
Search Outlook Forecast verifications
The September average extent per NSIDC was 4.61 m km^2
My SEARCH forecasts of this quantity were:
July, Adjusted gompertz method: 4.4 m km^2 +/- 1m km^2
August, Adjusted gompertz method: 4.3 m km^2 +/- 0.8 m km^2
September new predict change method: 4.45 m km^2 +/- 0.32 m km^2
September, superceded adjusted gompertz method 4.35 m km^2 +/- 0.4 m km^2
Thus the errors are 0.21m, 0.31m 0.16m and 0.26m km^2.
Therefore, my 4 predictions above were out by 0.4, 0.8, 1 and 1.3 standard deviations with all predictions being too low. The results were therefore not disasterously bad being out by about the amount that could be expected. There were several SEARCH predictions that were nearer: For July, 7 were close and 7 further away. For August, 12 were closer and 8 further away. For September, 3 were nearer and one was the same.
However looking in more detail the results may be a little better than indicated by results above. None of the methods attempted to predict weather and what effects this would have. My opinion of the weather in early September is that it could have been a lot worse for melting and advecting ice. There is a risk that such a judgement is clouded by wanting to maintain the methods I used should be expected to perform reasonably well and did not do so this year because of the weather. I hope and think my judgement of the weather is reasonably well backed up by posts and comments at Neven's Arctic sea ice blog. Had the weather been such that more ice had been lost, the predictions may have outperformed other SEARCH contributions rather than underperforming.
As 3 of the 4 predictions were attempting to update a gompertz prediction as carried out by Hamilton, it make sense to compare to that prediction. 3 out of 4 forecasts predicted lower than the gompertz fit when the outcome was higher. Again this looks poor. However the variability explained by the methods is less than the remaining variability. A large part of the remaining variability can reasonably be described as weather. Therefore we should expect that in some years the weather could act to cause the direction of the change to be wrong. Given the comments on the implications of the weather for ice loss in September I have seen, this could be one such year and the adjustments to the gompertz fit method could still be regarded as being expected to be useful even though the adjustments were in the wrong direction this year.
Conclusion
While the predictions underperformed relative to other SEARCH contributions, this may in part be down to the particular weather conditions in September and perhaps late August. The methods did not underperform significantly and given the weather that occured this year, the method seem worth continuing or improving rather than dropping them.