
The Time Scales of Political and Climate Change Matter
The US is engaged in the laborious process of electing a new leader, who will likely be President for 8 years. Climate change has finally become an issue in US electoral politics. The climate policies of the next US President, and the Congress, will have a direct impact on the climate, because those policies will affect how much fossil carbon is put into the atmosphere over coming decades. So it is vital to consider what the climate may do during the next administration and the longer period that will include that administration’s effective legacy period, more or less the next decade starting now.
There is evidence that the ongoing warming of the planet’s surface is likely accelerate in the near future. Recent decades have seen the Earth’s surface temperatures go up at a relatively slower than average rate compared to earlier decades. The best available science suggests that this rate is about to increase. We can expect a series of mostly record breaking months and years that will add up to an alarmingly warm planet.
(The graphic showing continued global warming through 2015 at the top of the post is from here.)
The Rate Of Global Warming Is About To Increase
I wrote about this last February, in discussing a paper by Steinmann, Mann, and Miller, that said:
The recent slowdown in global warming has brought into question the reliability of climate model projections of future temperature change and has led to a vigorous debate over whether this slowdown is the result of naturally occurring, internal variability or forcing external to Earth’s climate system. … we applied a semi-empirical approach that combines climate observations and model simulations to estimate Atlantic- and Pacific-based internal multidecadal variability (termed “AMO” and “PMO,” respectively). Using this method [we show that] competition between a modest positive peak in the AMO and a substantially negative-trending PMO … produce a slowdown or “false pause” in warming of the past decade.
That research was also discussed by Chris Mooney and John Upton. John Upton updated this discussion earlier this week, noting,
Cyclical changes in the Pacific Ocean have thrown earth’s surface into what may be an unprecedented warming spurt, following a global warming slowdown that lasted about 15 years.
While El Niño is being blamed for an outbreak of floods, storms and unseasonable temperatures across the planet, a much slower-moving cycle of the Pacific Ocean has also been playing a role in record-breaking warmth. The recent effects of both ocean cycles are being amplified by climate change.
Why Does The Rate of Global Warming Vary?
This is pretty complicated, and even those who are on the cutting edge of this research are cautious in making links between their models and the on the ground reality of warming in the near future. The long term rise in surface temperature, which is what we usually refer to when using the term “Global Warming,” is not steady and smooth, but instead, it is rather squiggly. But the ups and downs that accompany the general upward trend are mostly caused by things that are known.
The sun provides the energy to warm the Earth’s surface, and this contribution changes over time, but the sun varies very little in its output, and thus has less influence than other factors. The sun’s energy warms the Earth mainly because our atmosphere contains some greenhouse gasses. The more greenhouse gas the more surface warmth. As humans add greenhouse gas (mainly CO2 released by burning fossil fuel) the surface temperature eventually rises to a higher equilibrium. But the variation in the sun’s strength is hardly observable.
Aerosols, also known as dust or in some cases pollution (or airborne particles) can reduce the surface temperature by intercepting some of the Sun’s energy on its way to the surface (I oversimplify). These aerosols come mainly from industrial pollution and volcanoes. The addition of a large amount of aerosol into the atmosphere by a major volcanic eruption can have a relative cooling effect but one that lasts for a short duration, because the dust eventually settles.
There are many other important factors. Changes in land use patterns that cause changes in effectiveness of carbon sinks – places where atmospheric carbon (mainly CO2) is trapped in solid form by biological systems – increase atmospheric CO2. Melting glacial ice takes up heat and influences surface temperatures. And so on.
The biggest single factor that imposes a squiggle on the upward trending line of surface temperature is the interaction between the atmosphere and the ocean. Close to 100% of the extra heat added to the Earth’s system by global warming ends up in the world’s oceans. The heat is moved into the ocean because the surface warms up (from the sun) but surface water is constantly being mixed into lower levels of the ocean, and visa versa. When it comes to the Earth’s surface temperature, the ocean is the dog and the surface is the tail.
A famous, and now perhaps infamous, example of this interaction between ocean and air is the El Niño Southern Oscillation (ENSO). Here’s the simple version (see here for more detail). The equatorial Pacific’s surface is constantly being warmed by the sun. The surface waters are usually blown towards the west by trade winds. (Those trade winds are caused in part by the rotation of the Earth, and in part by the ongoing redistribution of excess tropical heat towards the poles). This causes warm water to move west, where it is potentially subducted into the ocean, moving heat into the sea. That heat eventually may work its way out of the ocean through various currents.
During many years, the ins and the outs are similar. During some years, La Niña years, the amount of heat moving into the ocean is larger, which can cause a small cooling influence on the planet. Every now and then, the reverse happens. This involves complicated changes in trade winds and ocean currents. A good chunk of the heat that has been stored in the Pacific now emerges and is added very abruptly, over a period of several months, to the atmosphere. This is an El Niño event. We are at this moment experiencing one of the strongest El Niño events ever recorded, possibly the strongest (we won’t know until it has been going a while longer.)
ENSO is one, in fact the biggest, example of atmosphere-ocean interaction that influences surface temperatures. But, ENSO is only one part of the interaction between the Pacific and the atmosphere. There is also a phenomenon known as the Pacific Multidecadal Oscillation (PMO). For its part, the Atlantic has the AMO, a similar system. These phenomena are characterized by a general transfer of heat either into or out of the ocean, with several years in a row seeing more heat move into the ocean, followed by several years in a row of more heat moving out of the ocean.
Though ENSO and the PMO are distinct processes, they may be related. I asked climate scientist Michael Mann if he views El Nino as part of the larger scale system of PMO, or if El Niño essentially rides on top of, or acts independently from PMO. He told me, “I would say the latter. At some level, the PMO really describes the long-term changes in the frequency and magnitude of El Niño and La Niña events, i.e. change in the behavior of ENSO on multidecadal timescales, and it will appear as multidecadal oscillation with an ENSO-like signature with some modifications due to the fact that certain processes, like gyre-advection and subduction of water masses, act on longer timescales and do they are seen with the PMO bot not El Niño or La Niña.”
The influence of ENSO on global surface temperatures is well illustrated in this graphic from Skeptical Science.
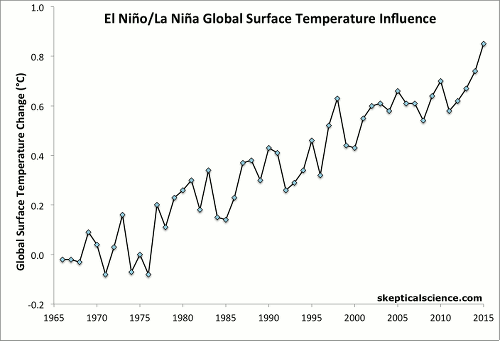
Here, the surface temperature anomaly is shown from the late 1960s to the present. The annual values are classified into years during which ENSO was neutral, or neutral with volcanic influences, La Nina years, and El Niño years with or without volcanoes. A separate trend line is shown for years that should be relatively warm (El Niño), relatively cool (La Niña), and years that should be about average.
The influence of the PMO is also apparent.
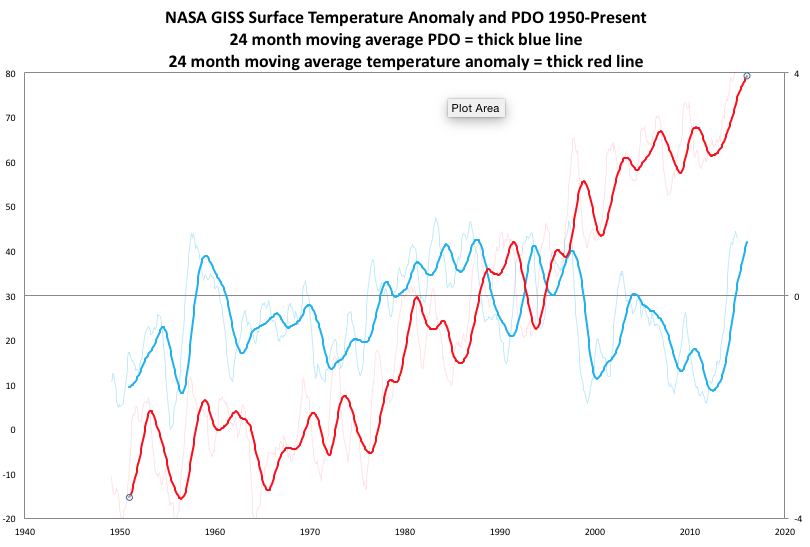
This graphic shows the measurement of the Pacific Decadal Oscillation and the surface temperature anomalies. The data are averaged out over a two year cycle (otherwise the PDO would be way too squiggly to be useful visually). Notice that during periods when the PDO is positive (adding heat to the atmosphere) there tends to be a stronger upward trend of surface temperature, and when the PDO is negative, the surface temperature rises more slowly. Remember, a lot of other factors, such as aerosols, are influencing the temperature line, so this relationship is quite imperfect.
Also notice that both lines trend dramatically upward near the end of the graph. This reflects the last couple of years (including right now) of dramatically increasing surface temperatures, and an apparent positive shift in the PDO. Just as interesting is the negative PDO associated with a reduced upward trend in the surface temperatures, fondly known by many as the “Hiatus” or “Pause” in global warming, during the first part of the 20th century. Indeed, it is likely that this slowdown (not really a pause) in warming is largely a result of a higher rate of excess heat being plowed into the oceans, and less coming back out. This is also a period during which the ENSO system produced no strong El Niños.
But the PDO is, as noted, part of a larger phenomenon of ocean-atmosphere interaction. The study noted above by Steinman, Mann, and Miller takes a broad view of these oscillations and their impact on climate. In RealClimate, Mann writes,
We focused on the Northern Hemisphere and the role played by two climate oscillations known as the Atlantic Multidecadal Oscillation or “AMO” … and the … Pacific Multidecadal Oscillation or “PMO”… The oscillation in Northern Hemisphere average temperatures (which we term the Northern Hemisphere Multidecadal Oscillation or “NMO”) is found to result from a combination of the AMO and PMO.
…Our conclusion that natural cooling in the Pacific is a principal contributor to the recent slowdown in large-scale warming is consistent with some other recent studies…
…the state-of-the-art climate model simulations analyzed in our current study suggest that this phenomenon is a manifestation of purely random, internal oscillations in the climate system.
This finding has potential ramifications for the climate changes we will see in the decades ahead. As we note in the last line of our article,
Given the pattern of past historical variation, this trend will likely reverse with internal variability, instead adding to anthropogenic warming in the coming decades.
That is perhaps the most worrying implication of our study, for it implies that the “false pause” may simply have been a cause for false complacency, when it comes to averting dangerous climate change.
What Will Global Warming Do During The Next Decade?
Have political leaders and representatives been lukewarm on climate change over recent years in part because the climate change itself has been less dramatic than it could be? And, conversely, is it the case that the next couple of decades will see a reverse in both? I asked Michael Mann if his research indicated that the indicators such as the PMO, AMO, or the derived NMO, show that the oceans are about to contribute to a speedup in warming. He told me, “…both PMO and AMO contribute to NMO, but in recent decades PMO has been the dominant player, and yes, I would expect to see the recent turn toward El Nino-like conditions and enhanced hemispheric/global warming as an apparent upturn in the NMO, though it is always difficult if not impossible to diagnose true change in the low-frequency signal right at the end of a time series.”
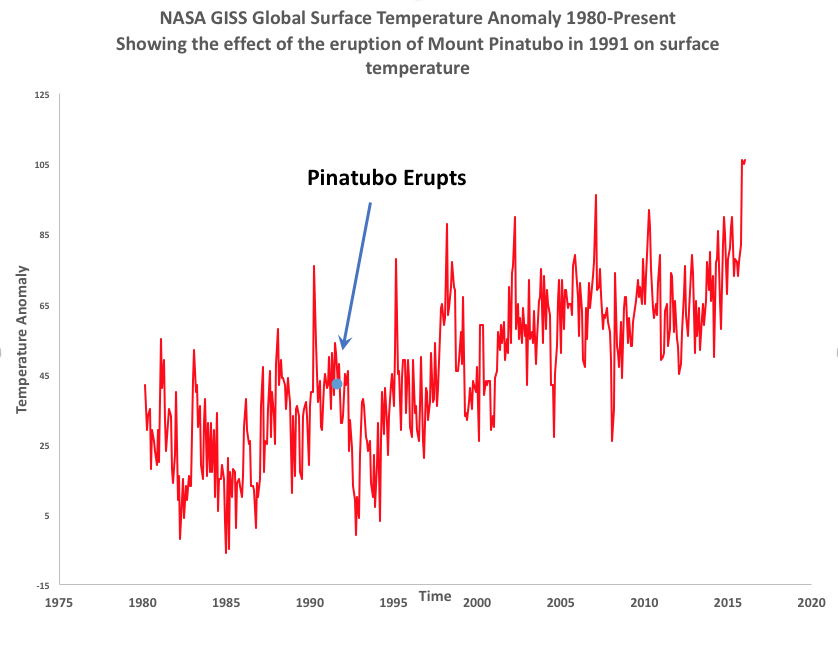
Let’s have a closer look at the influence of the PDO on global surface temperatures. Since the human influence on the atmosphere has grown over time, we want to focus on more recent decades when the input of additional greenhouse gases had already risen to a high level. This graphic shows the NASA GISS surface temperature anomaly values (the dots) from 1980 to the present, but with some trend lines added in.
(The NOAA GISS data are a running 12 month mean using the monthly data. Note that the trend lines added to this graph are meant to visually underscore the differences between time periods in the overall trend, and have no special statistical value.)
The black dots and the curvy trend line to the left represent a period of time when the PDO was positive, but also includes a depression in surface temperature because of the eruption of Mount Pinatubo. I made the trend line a “second order polynomial” instead of a regular straight line. A polynomial equation can capture internal curviness of a series of data.
(A polynomial equation that is of the same “order” as the number of points in the data set would, theoretically, zig and zag back and forth to account for each data point’s position which would be absurd. One must be careful with poylnomials. But a second order polynomial can honestly reflect a modest curviness in a series of data, and in this case, helps the line do its job at visually presenting a short term pattern.)
The second series of data, in blue, shows a period of mostly negative PMO, again, with a second order polynomial line drawn on it. This is the period of time that includes the so-called “hiatus” in global warming, when the upward trend of increasing surface temperature was somewhat attenuated. That attenuation was probably caused by a number of factors, and in fact, at least one of those factors had to do with inadequacies of the data itself, in that the measurements fail to account for extreme warming in the Arctic and parts of Africa. But the negative PMO, and likely, according to Steinmann, Mann and Miller, a larger scale relationship between atmosphere and ocean, seem to have somewhat flattened out the line.
But then we come to the third part of the data, in red. The ocean-atmosphere relationship has switched the other way. The PMO has been positive since the last part of 2013, and over a smaller and more recent time frame, we have been experiencing a strong El Niño.
This graphic does a nice job showing how short and medium term upward and downward trends eventually cancel out to produce a single upward trend in global surface temperature. Very short term shifts such as a given El Niño event or a given Volcanic eruption cause the most obvious squiggles. Somewhat longer term, multi-decade trends such as the PDO cause longer parts of the series of measurements to rise more or less quickly. But over nearly 40 years shown here, and longer periods, all the ups and downs average out to a single trend that can be reliably projected for a reasonable period of time.
Will More Rapid Global Warming Spur A More Effective Policy Response?
These ups and downs in the rate of warming are not important to the long term trend, but they are important because of their immediate effects on weather. And that is all that should matter. But these short and medium term trends, as well as even more immediate events such as individual storms, take on a greater importance that has nothing to do with the science of climate change itself. These changes affect the way politicians, advocates, and the general public, regard climate change, and serve to motivate or attenuate action on one side of the false debate or another.
We have known enough about climate change and its causes to have started the shift from fossil fuels to alternative strategies for producing energy long before 1980, but have in fact done very little to solve this problem. Initially, climate change seemed more like a thing of the future, and in fact, had relatively little impact on the most influential and powerful nations and people. Disruptions of weather patterns started to become more apparent around or just before 1980, but for the next few decades anti-science forces were well organized, and their efforts were enhanced, at the beginning of the 21st century, by the unthinking and unknowing process of air-sea interactions that reduced the rate of surface temperature increase even while weather patterns continued to become more and more chaotic.
But the truth is, a widespread flood in the American bottomlands defeats a snowball in the hands of a contrarian Senator. Eventually, more and more people in the US have been affected by inclement weather, and the frequency with which destructive storms of various kinds hammer the same subpopulation again and again has gone up. The symbolic snowball melts under the cold hard stare of voters who wonder how they are going to rebuild their lives after floods, severe storms, and droughts have taken away their property, in some cases their loved ones, and raised their insurance rates.
So the question emerges, will the next decade or so be a period of increased, or of attenuated, motivation from Mother Nature to act on climate change? The rational actor will act now, because we know that the greenhouse gas we pump into the atmosphere today changes the climate for decades to come. The reactionary actor with little capability or interest in thinking long term (i.e. most people) will be mollified by a decade with few severe storms, not much flooding, a seemingly secure food supply, and a snowball or two.
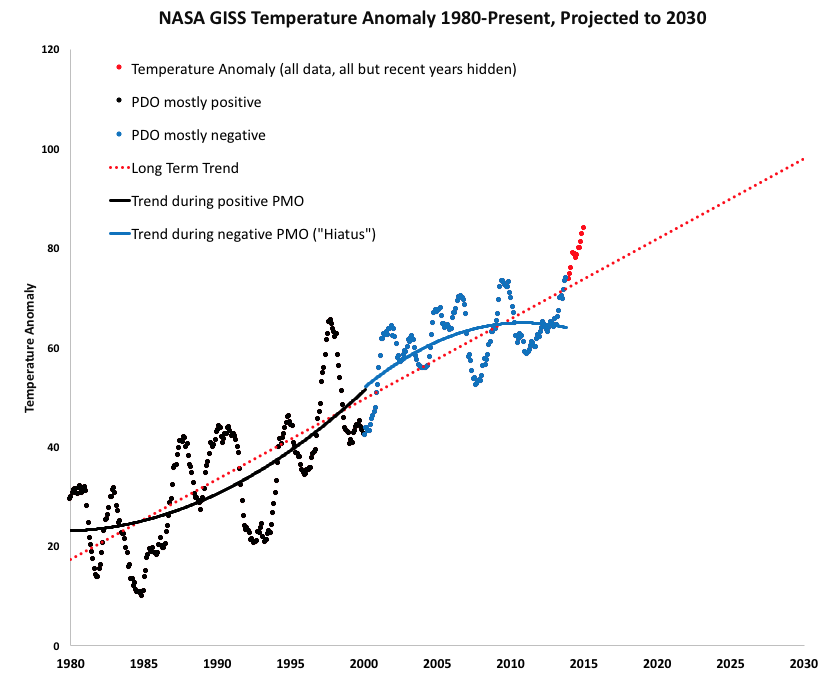
I left the projection of the future as a single estimate based on the past several decades (all the data shown on the graph). I could have imposed a more upward trending line, maybe a nice curve like these polynomials show, as an extension to the blue line. But since the graphic is going out a couple more decades, and the ups and downs average out over several decades, I think it is fair enough to use the linear projection shown by the red dotted line.
I’m not actually making a prediction of future global surface temperatures here. What I’m showing instead is that two things seem to be true. First, long term (over decades) global warming has happened and will likely to continue at about the same pace for a while. This has been going on long enough that by now we should viscerally understand that the squiggles are misleading. Second, the last couple of decades have been a period of reduced warming, but that period is likely over, and we are likely to experience an increased rate of warming.
Will surface temperatures during the term of the next POTUS squiggle about mostly above that red dotted line on this graph, or will those temperatures squiggle up and down above and below the line, or even below it? Based on the best available science, that first choice is most likely. Whomever ends up being POTUS, and the corresponding Congress, will be enacting (or failing to enact) policy during a period of surface temperature increasing at a rate higher than we have in recent years.
A vitally important known unknown, is what will the effects of such a rise in surface temperature be. We have various levels of confidence that storminess, changes in the distribution of rainfall, drought, and through the melting of glacial ice, sea level rise, are all important forms of climate disruption we are currently experiencing, and we should expect more of the same. The unknown is whether or not we should expect a dramatic acceleration of these changes in the short term future.
How will the insurance industry address an increase in widespread catastrophic damage caused by storms and floods? Will the government have to underwrite future losses, or will disaster insurance simply become something we can’t have? Will there be damage to our food production system that ultimately results in less certainly in the food supply, and how will we deal with that? The well known “reugee crisis” is a climate refugee crisis. But it may be a small one compared to what could happen in the future. Will we need to restrict development in mountain areas more subject to fires, and withdraw settlement from low lying areas along major rivers? How will we address more widespread and more severe killer heat waves?
The battle to preserve the use of fossil fuels exists at the state level in the US. Should we have a national effort to stop the legislatures in red states from putting the kibosh on local development of clean energy sources, either by energy utilities or individual home owners?
Sea level rise has already had several negative effects, but it is also is a longer term issue, and is perhaps among the most serious consequences of human greenhouse gas pollution. At some point, American politicians in some areas will be faced not with the question, “Will this or that Congressional district be represented by a Democrat or a Republican,” but rather, “Where the people who lived in this district go now that the sea is taking it?”
Over time, I think the social and political will to address climate change has grown, though very slowly. It might seem that the effects of climate change right now are fairly severe, with floods and fires and all that being more common. But while these effects are real and important, they have been minor compared to what the future is likely to bring. The anemic but positive growth of willingness to act has occurred in a political and physical climate that is less than nurturing of dramatic and effective action.
Whoever is elected president this time around, and the Congress, will serve during a period when the people’s will to act will transform from that inspired by activists pushing for change, to outcries of a larger number of desperate and suffering newcomers to the rational side of the climate change discussion.
Expect a sea change in the politics of science policy.
Added: See this recent post by Peter Sinclair, and his video:
Question what is man's # 1 instink greed ,do you really think your going to get unbiius answer,when a monitory loss is seen with the answer.Right now the market is these people's main concern.If you think that wont be a factor in the decision and people see it as life or death,you think thats over kill.When was the last time we have been hear.Like the titanick, you could stop ever thing, but it will take 2-3 year's to see a change. You have to decide now,putting the fox to watch the hen house. get the old timers out,get young college people where money is not a factor and not die hard people that think the country comes first,they will see it;s the world is there country.please
Shared. Truth. Choose wisely please :
https://www.youtube.com/watch?v=puo1Enh9h5k
Since I have some age under my belt, I expect that this El Nino will have similar characteristics as the last two record El Ninos. It got hot, and stayed hot, until the next El Nino, then we took another step up the temperature ladder.
And as to the politics, well, I thought Obama 'got' how dangerous the situation was becoming. And, instead of working on emissions, he allowed the US to increase it's fossil fuel production to record levels. So, beware of those that say they understand. Don't can't count on anyone, except yourself.