Most observers of climate change media coverage long ago stopped wringing their hands every time Fox News reported that global warming has stopped and that humans are responsible anyway, mostly to avoid calluses. A while back it seemed like Fox might be ready to embrace the actual science, but old habits die hard. For example, Fox took a Sky News story back in August that suggested we may be on the verge of returning to record warm years and gave it the headline of "Natural Factors Could Cause Global Warming."
Yes, the story was about solar activity, but here's the nub of the science that was being reported:
... the relatively cool years since have prompted some to suggest global warming is not happening. The new study, carried out by Judith Lean, of the US Naval Research Laboratory, and David Rind, of Nasa's Goddard Institute for Space Studies, says the opposite may be true.
Same old disingenous treatment. Again, nothing new under the Fox News sun. So to speak.
But when the once-venerable BBC does something similar, it's time to worry.
Here's the headline to a BBC story posted Oct. 9: "What happened to global warming?" Nothing wrong there. It's almost exactly the same as a talk on the subject I delivered the previous evening at the Saluda Community Library here western North Carolina.
But here's the opening paragraphs:
This headline may come as a bit of a surprise, so too might that [sic] fact that the warmest year recorded globally was not in 2008 or 2007, but in 1998.
But it is true. For the last 11 years we have not observed any increase in global temperatures.
And our climate models did not forecast it, even though man-made carbon dioxide, the gas thought to be responsible for warming our planet, has continued to rise.
The story, by BBC climate correspondent Paul Hudson, who, as a climate correspondent, might be expected to have at least a passing familiarity with the science associated with his beat, goes on to present "both sides" of the debate. He found two skeptics who have long argued against the mountains of evidence on which the case for anthropogenic global warming is built, and gives them yet another platform.
Key to the skeptic's point of view is the notion that the hottest year on record is now more than a decade in the wrong direction. But as Hudson should know, there is no widespread agreement among climatologists that 1998 was the hottest year. It's the sort of thing that Fox News likes to quote, and British audiences do tend to hear it more than those of us on the other side the Atlantic because it's what the UK's Hadley Center data show.
But the Hadley data constitute just one set. Another set, this one from the Goddard Institute for Space Studies at NASA, says 2005 was warmer. If you want to know why there's a difference and, more importantly, whether it matters, you can read this excellent, but a little technical, explanation at Real Climate.
I will summarize for those who have come to my blog in hopes of not having to go somewhere else to sort it all out.
The Hadley data set does not include the extreme northern reaches of the Arctic because we don't have any monitoring stations there. The GISS data does include the Arctic, and the GISS climatologists supply that information by extrapolating from the northernmost stations. The Hadley teams essentially assumes the Arctic is warming at the same rate at the rest of the planet while the GISS folks assume that it's warming as fast as those northernmost stations.
The result is NASA reports the warmest year on record is 2005, while Hadley says it's 1998.
Both are probably off by some factor, and it can even be argued that as all the good climate models say the High Arctic should be warming faster that stations a little further south, the real gap between the GISS and the Hadley graphs would be even wider than presented. But the important thing is, the difference between the two teams' stated temperatures of 2005 and 1998 is tiny. It might as well be considered a statistical tie because both teams are including assumptions about what's going on in the Arctic to produce their final, annual global averages.
Furthermore, if one considers temperature records by decade, rather than by year, we're still in the warmest decade on record. The longer your yardstick, the more obvious it becomes that the warming is continuing.
And we haven't even mentioned the fact that the oceans are warmer than ever, regardless of the atmospheric trends. Or the fact that 1998 was an extreme El Niño year. Indeed, let's look at what happens if you take the El Niño phenomenon, which just moves heat back and forth between the oceans and the air, out of the record:
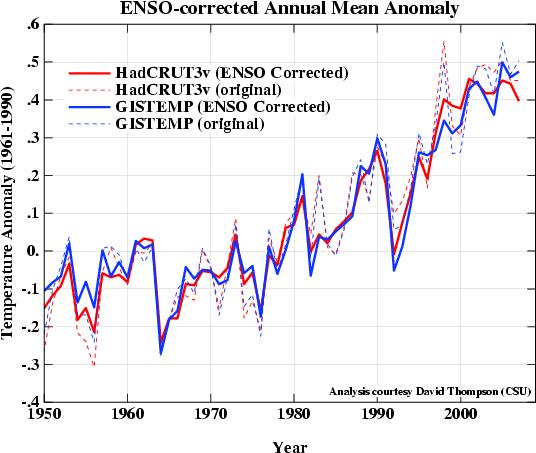
(Source: Real Climate)
Anyone who insists upon arguing that the climate has cooled since 1998 is misrepresenting, either deliberately or through ignorance, what the temperature records say about the subject. That the BBC should descend to that level is most surprising, and disappointing.
what metric do the numbers on the y -axis represent?
the zero mark is an arbitrary year's global average temperature. It doesn't matter which year you choose; the trend will be the same.-- jh
The satellite record disagrees with the UHI contaminated ground records.
The satellite records have the temperature bouncing up and down anwhere from 1C below 1998 to .4C below 1998.
It has cooled since the 1998 peak. And warmed and cooled etc etc.
But it is now .4C cooler than 11 years ago and about the same temperature as it was 20 years ago.
Global Warming? Nope. That was a hoax.
And by the by ...
ENSO corrected? Why would you correct for a natural climate phenomena? (other than to hide the 1998 spike that kicked off the AGW hysteria and pretend the temperatures have steadily increased rather than the reality of one big spike and no rise since?)
Bruce;
Why would you take the satellite data, which doesn't measure the temperature directly but has to be calculated and adjusted, over directly measured data?
If you remove all of the WUWT 'bad' sites and just use the 'good' sites the trend is pretty much the same. This shows that the adjustments used for those sites possibly prone to UHI are accurate.
Bruce;
If you can't understand the reason James removed the ENSO then you're too ignorant to be arguing against AGW. Look up the difference between noise and signal.
What got me was that the two named "skeptical" scientists are Don Easterbrook and "solar scientist" Piers Corbyn.
Easterbrook is a retired geologist with a bee in his bonnet about the PDO - but at least he is (or was) a scientist.
Corbyn is little more than a snake oil salesman - he claims to predict the weather and the climate from studying the Sun, but he keeps his methods secret and has never published anything in the literature. Telling the difference between him and the astrologer Theodor Landscheidt isn't hard - Landscheidt was more open about his methodology.
I will be writing to the BBC. I assume that you won't object to my posting a link back to your blog. :)
There is something wrong with the Preview button - When I tried to use it on my last post (and indeed this one) I kept getting
"Publish error in template 'Comment Preview': Error in tag: Can't find included template module 'HTML Head' "
I'd guess that this is a scienceblogs issue rather than a problem with your blog, though.
The reason I prefer satellite data is that the +2C or more UHI contamination does not occur.
Many rural sites have been removed and the ground record is dominated by urban sites and airports.
As for removing ENSO ... the whole point of that is to smooth the graph into looking like a regular rise instead of the realiy ... one big jump and nice and steady .4C to 1.0C cooler years since then.
1998 is an aberration used by the AGW chicken littles to scream "the sky is falling".
The AGW cult has to remove it the same way they have to remove the Medievil Warm Period.
But Steve McIntyre has placed in a nail in the Birffa Yamal hcokey stick coffin hasn't he?
Bruce, are you really that stupid? You think that the intentional decoupling of satellite data from ground proofing is a way to get BETTER data? That showing the data that has a known, fairly well understood fluctuation filtered, with the unfiltered data clearly shown on the SAME GRAPH is some sort of massive distortion? GTFO, and may basement cat nom on your harbles for all eternity.
You didn't address any or my points Robert. Just like Al Gore never allows anyone to ask him question.
I've made my points.
If you wish to read about airports dominating the ground data:
"Once again, the bulk of temperatures comprising the present-day worldwide GISS average come from airports â in this case 554 airports, according to the NOAA metadata from the V2 station inventory. In the US, the ratio of airports to total stations continues to run very high, with 121 out of the 134 reporting stations being located at airports."
http://wattsupwiththat.com/2009/07/15/giss-worlds-airports-continue-to-…
121 out of 134 US reporting stations are at airports.
Do you REALLy think the temperature at those airports really represents an accurate survey of the rest of the USA?
I don't. It doesn't. Its a cruel joke to suggest a miniscule rise in temprature at airports during the period when air travel exploded represents much of anything, other than UHI contamination.
From 1960 to 2006 the # of passenger miles went from 33 million to 590 million in the USA.
http://www.bts.gov/publications/national_transportation_statistics/html…
When most temperature station are at airports, all you are measuring the is extra warmth generate by an 18x increase in miles travelled ... which includes more car traffic to the airports and all the extra roads built to airports and all the people and all the tarmac added to runways absorbing more solar energy and all the extra jet fuel burned.
On top of that most airports used to be much futher fromt he center of the urban heat bubble. But cities have increased in size and the urban heat bubble now overlaps most airports.
You aren't measuring AGW. Just UHI effects.
Bruce;
I take you are using UAH numbers. Nice cherry picking.
Urban temperatures are calibrated by comparing values to the rural trend.
There are 70 sites Watts claims are OK. In other words there is no UHI. When those sites are the only ones used, the resulting trend is the same as when all the sites are used and, if necessary, corrected.
Since we are interested in trend rather than absolute temp, how does UHI affect the trend?
Again, I ask, why would you use data that does not measure surface temperatures, but measures tropospheric temps indirectly, over data from something that directly measures surface temps?
The 1998 ENSO was 2.66 standard deviations above the trend. That makes it an outlier in most books. What you suggest we do, by giving 1998 high significance, is ignore the trend and focus on the noise. The trend is what we are looking for, we already know that there is natural variability. Removing noise to see the trend is done in all scientific disciplines.
The MWP is irrelevant, the science is looking for cause and each trend variation has to be examined on its own. If you assume that the cause for this upward trend has to be the same as for previous trends you are not doing science.
McIntyre didn't even bother to learn why certain cores are used, he just assumed the bigger the sample the more accurate the conclusion. Unfortunately for him, his number include a bunch of junk not appropriate for the intended use.
Take another look at McIntyre's results, the divergence is during times where direct temperature measurements are available. His work contradicts those measurements.
No UHI?
"Why are âdarkâ stations important? Recall that GISS uses dark stations to adjust for UHI in the urban stations. With only 128 dark stations available, none being in the US, it would seem this is an impossible task."
There cannot be a valid UHI adjustment for UHI if there are no US "dark" stations.
Sorry GaryB. You FAIL.
As for ENSO and 1998. Remove 1998 from the trend and we are left with the 30s/40s as being the warm decades and in the USA, 1934 is still the warmest year.
In one way you are right. 1998 was an outlier. It was NOT an indication of any AGW trend any more than 1934 was. Outliers happen. Spending trillions to correct for an outlier year is insane.
What caused the MWp? Most like the same processes going on today. It is up to you to prove different.
CO2 kept rising after 1998. Temperatures did not. Your theory is dead.
McIntyre is spot on. The mythical hockey stick was a fabrication.
You FAIL GaryB.
Try thinking like a scientist. Your theory dided when CO2 rose and temps did not. Come up with another one. Review your data. Throw out the bad data like Briffa.
Quit acting like a polemicist.
Determining the actual global temperature is easy: we have a continuous satellite record of lower tropospheric temperatures for the last thirty years and it is available to all. If you want a complete analysis of it look me up on ICECAP and download two PDF files. What the record shows is that both Gistemp and Hadley have doctored their temperature curves and they don't look anything like actual world temperatures do. Their latest trick of eliminating ENSO variables is totally impermissible because they are substituting imaginary temperatures for real ones. I knew they were doing this in the eighties and nineties but now they are brazen enough to do it publicly. ENSO itself is an east to west oscillation of ocean waters set into motion by trade winds.Equatorial currents bring the water to the vicinity of Philippines and New Guinea where they are blocked. Return flow is then via the equatorial countercurrent which impacts directly on South American coast. This flow is periodic because we are dealing with wave resonance. As each wave of warm water splashes up against the South American coast it spreads out, produces an El Nino, and raises the global temperature by half a degree Celsius. It then falls back, starts moving west, and cold water wells up behind it. The name given to this cool phase of ENSO is La Nina, and they alternate in a four or five year cycle. These cycles show up beautifully in satellite records and there were five such cycles from 1978 to 1997.The average temperature of these oscillations stayed the same for all these years, meaning that for this twenty year period there was no global warming whatsoever. But what did Hadley and Gistemp do? They chose to show the warm El Nino peaks and reduce or eliminate the La Nina valleys in between, just so as to create a rising temperature curve - that famous "late twentieth century warming," the one that Hansen claimed existed in 1988. And then nature came to help them and produced that giant "super El Nino" of 1998. They quickly tied their fudged temperature curves to that El Nino and claimed it was just what they predicted. But it wasn't, and nobody had seen anything like this before. Its peak temperature anomaly was twice as high as any of the other El Ninos up to that point and it did not fit in with the other ENSO oscillations either. It was probably caused by Indian Ocean overflow that was channeled to the east by the equatorial countercurrent. The record clearly shows that it was warmer than any other peak within the last thirty years. After it subsided there was another warm period from 2001 to 2007, the twenty-first century high. It came to an end with a La Nina cooling in 2007 and since then we have returned to the ENSO oscillations that existed before 1998. None of the warming since 1998 was caused by carbon dioxide and now that it's all over and normal temperatures have returned it's time to close that Kyoto shrine and cancel the Copenhagen conference as no longer needed forthe real world,
Bruce's ignorance is almost hilarious ... but is it ignorance? Or does he know better but just doesnt want to take his share of the responsibility for the problem? ... Maybe he's just lazy and so picks the side that fits his wasteful life. maybe he's a sucker, or on the payroll of an oil company.
Does anyone here seriously think that the thousands of scientists involved didnt take UHI into account? Are you people really that stupid?
I can just imagine the scene if Bruce was at bestbuy buying music and headphones ... "wahh give my money back! Digital CD's and noise reduction headphones eliminated all the tape hiss and background noise from my music! Wah! Wah!"
1) The Hadley Center admitted they threw away the raw data for the HADCRU dataset (in the graph) and only have the massaged/manipulated data.
"The world's source for global temperature record admits it's lost or destroyed all the original data that would allow a third party to construct a global temperature record."
http://www.theregister.co.uk/2009/08/13/cru_missing/
2) GISS seems to have thrown out almost every rural site it could making it impossible to account for UHI. In fact what they do is smear the warm UHI contaminated sites over as big an area as possible.
Bwuce: "Does anyone here seriously think that the thousands of scientists involved didnt take UHI into account?"
As far as I know only 2 or 3 scientists actually work on the GISS and Hadley datasets. And Hadley "lost" the data.
Bwuce, insults are no substitute for facts.
"Corbyn is little more than a snake oil salesman". Kind of like Gore, no?
Bruce: No, the Hadley original data has not been lost, thrown away, deleted, or eliminated, and getting your info from the Register pegs you as someone not to be takes seriously.
This particular "story" is all based around the fact that McIntyre has been bugging Phil Jones at the CRU for a long time for all his raw data. Jones's reply has been that
(a) they don't immediately have ALL the raw data, because the raw data comes from partner organisations all around the world, and for some data sets they don't keep the original raw stuff after they clean up the set; and
(b) given that the data is actually collected by multiple organisations and some of those regard their data as proprietary, and there is a complex set of contracts governing who owns what (and, note, the originals of some of those contracts HAVE been lost), then permission has to be sought from all the participating organisations before data is released, and not all seem to be happy to share. In order to fulfill McIntyre's FOI request, Jones and his team would have to manually review the sources of decades of global data, re-request a number of the raw files from multiple sources and obtain those sources' permission to share said raw data rather than the aggregate sets -- and yes, raw vs. aggregate data does make a legal difference. All in all, we are talking about hundreds if not thousands of man-hours. I do get the impression that Jones isn't about to go out of his way to help out McIntyre, which isn't surprising given that McIntyre hasn't exactly established a reputation as a reputable academic, certainly hasn't made any friends or attempted co-operative collaboration with anyone at the Met, and in fact seems to spend much of his time accusing most other people in the field of fraud and incompetence.
Anyway, the whole thing about "Hadley deleted their data!" seems to be made up on the basis of one statement: "We, therefore, do not hold the original raw data. [from all sets]" What Pielke has spun this to mean is that "CRU has lost track of the original data!?" Actually, that is not what it means; what it means is, like I said, that someone would have to go back over a huge dataset and check what all the tens of thousands of sources involved are, get the raw source again for each subset of numbers, and confirm what agreements cover them. I've dealt with "information forensics" like that before; it can be done, but it is an absolute nightmare.
Given the very real history of McIntyre and friends and their attitudes of no actual research of their own, just contempt for researchers, this is asking already busy people to do a huge amount of unpaid work for an avowed enemy. And given that the raw data *does* come from all over the world, if McIntyre had more real desire in mind than just making life miserable for other climatologists, he could get the list of those organisations and contact them asking for data directly. So far as I can tell, although the waters are pretty muddy, the list of involved organisations is not what he asked for. He just wants all the HadCRU data, all of it, exactly as they would have had it in source.
Of course, in an ideal world all raw data would be available for ANY set of papers. We don't live in an ideal world. Welcome to the real world, full of messy commercial interests and contracts, not to mention personal reputations. I don't think it's great, but if I were Jones I have to admit I would also be tempted to simply tell McIntyre, "f*** you, go bug somebody else."
Having dealt with a lot of academics, although it is obviously and understandably difficult for people outside research to get how these information requests could possibly be harassment, to an academic it sure as hell looks like harassment. These data are not being requested in order to further our understanding of the real world, given how McIntyre et al. have acted in the past, and the fact that we have more than a 5-minute attention span and memory; it's all being requested purely to further accusations of incompetence, by people who themselves have not covered themselves in glory when it comes to analyses. Webster is a "real researcher" with legitimate research interests, who requested a specific set of data for a specific research purpose, which will be subject to proper publication and peer review, so the organisation gave him raw data; McIntyre, not so much. His track record is simply that he will write hundreds of blog posts and opinion and editorial pieces about how crap it all is, to feed a non-scientific media noise machine.
There's more about the background to this here:
http://blogs.nature.com/climatefeedback/2009/08/mcintyre_versus_jones_c…
McIntyre and his fans obviously have a different take on this, but my own personal observation is this: when you have built up your fan following based on calling people liars and incompetents, do not then turn around and expect those people to go out of their way to help you. And I personally note that McIntyre does not hesitate to demand things which make a lot of extra work for other researchers, but when asked if he will publish "better" analyses responds that it will take too much time and he has no real interest in doing so, and will only consider it if someone pays him for it. Right.
There are reasons why a majority of active climate researchers dislike Pielke, McIntyre and that gang, and it has nothing to do with any conspiracy. Deal.
Bruce also quotes Watt:
121 out of 134 US reporting stations are at airports.
Perhaps you would be so kind as reporting where the information comes from that the US only has 134 reporting stations??? I know Watt says it, but where does he get his figure from? Because nothing I can find indicates that few stations in the US.
Beginning your graph at 1950 is the biggest cherry-picking ever. This is why people dont take climate change seriously, because the facts are derived from "manipulated information"
Luna, your excuse for Hadley losing the raw data is wrong except for this part: "they don't keep the original raw stuff after they clean up the set"
They don't have it anymore. Period. Its gone. Dead. No longer with us.
Therefore ... HADCRU's "methods" are no longer science. They are like a magicians hat. Something was pulled out of it, but it ain't science.
1934 is the hottest year on record in the 48 states
http://www.bizzyblog.com/2007/08/10/rushs-and-bizzyblogs-see-i-told-you…
The ultimate proof that Bruce is nothing but a self-serving quack, if not a paid disseminator of mis-information can be seen in one simple and blatant irony in his message:
Bruce says AGW is bunk because he thinks (incorrectly) that scientists have not dealt with background noise in the data (UHI) ... yet he refuses to accept that other background noise (ENSO) must also be removed from the data.
You can't have it both ways little boy Bruce, EPIC FAIL
Bruce's next epic fail is his child like ignorance of how background noise is removed from data. The only manipulation of data going on here is by Bruce.
Don't be a victim of the Bruce.
I would so love to see a video of the Bruce on Youtube, at BestBuy, complaining that digital music and noise reduction headphones removed all the static from his music.
Bwuce, UHI is not background noise. Noise implies some random up and down value.
UHI adds a relatively steady value (up to 4C) to most urban temperatures. It has a different effecton day and night temperatures. Since UHI is about 8x larger than the alleged increase caused by CO2, it must be meticulously accounted for.
It isn't.
http://www.innovationmagazine.com/innovation/volumes/v3n2/free/coversto…
Try reading. Insults are not a replacement for critical thinking.
Luna,
"Numerous peer review papers suggest an exaggeration of the warming by 30%, 50% or even more. The station dropout can be clearly seen in the two maps below with the number of station going from over 6000 to just 1079 from April 1978 to April 2008."
http://wattsupwiththat.com/2009/10/13/how-bad-is-the-global-temperature…
Globally there are now 1/6th as many stations as in 1978.
As the article shows though, some closed stations kept on producing data because of infilling.
Follow the instructions int he article.
Click here: http://data.giss.nasa.gov/gistemp/station_data/
Then (for example) click Washington State.
35 stations. Only 2 have data in 2009.
Texas. 5 out of 32.
Etc.
Luna, one last thing. Checking Texas and Washington, not one of the sites with 2009 are classed as "Rural Area".
How can you do proper UHI adjustments without Rural stations?
If you want to manipulate the data, just drop all the rural stations. Instant warming in the urban sites and airports that are left to dominate the list.
The Climate Change issue appears to be in grave doubt.
Right now, it seems that a little judicious cherry-picking of climate-data will allow anyone to claim they have found real proof of their own preferred climate change theory.
As we have, from 2008 onward, entered one of the lowest periods of solar activity in well over 100 years, I prefer to wait several years for more definitive cherries to ripen before making any decision. The past is prolog.
So... The NASA dataset tries to make estimates of the northern regions based of their northernmost stations?
Now, if I take a look at:
http://data.giss.nasa.gov/gistemp/2008/
... Yeah, I'm not seeing any trends throughout the rest of the world that would make me buy that line. Note that Antarctica doesn't follow any sort of trends; some hot some cold.
Not to mention, the NASA dataset was compiled by Dr. James Hansen (see the bottom of the previous link). Given Dr. Hansen's past (see http://en.wikipedia.org/wiki/James_Hansen#Responsibility_for_climate_ch… for a summary), I'm not inclined to believe that changing the data like that is totally unbiased.
Perhaps global warming is happening, perhaps it isn't. I'm more inclined to believe that the climate is not even remotely understood.
Bruce: you illustrate the principle of "I don't care what you say, I refuse to believe you." I'm not providing an "excuse" for Hadley "losing" any data. I've tried to provide you with a good faith and understandable explanation of why they don't simply have it lying around ready to hand over to McIntyre at a moment's notice. But you like the spin better, I guess. I'm afraid that the spin is what gets hyped. Nevertheless, the simple fact of the matter is still, no data has been totally lost -- ESPECIALLY given that the sources of that data still have raw data on the separate sites! The fact that it isn't available quickly or to absolutely everyone does not mean, and has never in any academic or business setting meant, that it is "lost." If you are interested in accuracy, please ACT like it.
Second: Thank you for the reference on station numbers. Clearly, there has been a greater attrition of climate monitoring stations in the US than I thought; checking the GISS pages, it seems like this year is roughly 1/3 the level of active stations from 2007. I have to wonder if that was the 2008 budget pinch closing down research which was only providing results inconvenient to the government anyway. Regardless of reason, I concede the small number and would very much like to see that fixed. HOWEVER, I also notice that on the list of still active stations, more than 50% still appear to be rural, contra to your claim. Also, picking 1978 as the reference point for comparison is an interesting choice, given that 1975-78 represents a peak in numbers not even vaguely approached before or since. Why not compare the numbers to 1951?
But your claim regarding the UHI invalidating trends actually doesn't make any sense anyway. First of all, trends can readily be detected from urban stations which have always been urban. The absolute temperature being higher than that of rural stations makes no difference whatsoever when you are comparing data from an urban station to earlier data from the same urban station. And when a rural station becomes urban, adjustments ARE made to compensate -- and this can be done because first, the majority of states still have rural stations, and second, far MORE rural stations have existed until very recently in order to provide a consistent picture of the difference between urban and rural. If, for the past 20 years, one can see that urban stations consistently run, say, 2 degrees hotter than rural, and this is relatively invariant throughout this time period and across a number of states, then perhaps you ought to have a rationale for claiming this changes as soon as you lose some rural reference points (even when it stays the same where rural and urban reference points are still closely available). If you are claiming that the loss of rural stations is used to artificially bump up the mean, the aggregate number derived from station data, then you need to ignore the fact that the aggregate number is from adjusted data, not raw, so the UHI is still compensated for.
Overall, though, your claim seems to be that (a) the raw, unadjusted data is somehow better or more important than the adjusted data, and that (b) the fact that the unadjusted data has blips in it where station circumstances have changed makes it useless. Well done, you have very neatly set up a "heads I win, tails you lose" scenario where you feel justified in ignoring all the data.
What really comes out of these complaints, though, is that you genuinely think that climatologists are either stupid and deluded, or deliberately dishonest. You also think that there are only a small number of people in the world with access to the actual data, thus making a conspiracy feasible? Despite the fact that there are STILL over 6,000 active monitoring stations in ~200 countries? Being monitored and maintained by thousands of people overall?
It's not like we even lack multiple lines of evidence all pointed in the same direction. It's interesting and a good exercise in accuracy to quibble over the minutiae of each station's exact data, but that data lands on top of worldwide monitoring data from both other land-based stations and from satellite, from absolutely unequivocal glacial melts, and weather changes and changes in the ocean. There is quite a consistency between measured temperature trends and other observation, as well as with our understanding of the physics and chemistry of greenhouse gases. I would have to agree that we now have too few active monitoring stations in the continental US for comfort, that there ought to be better archiving of raw data, and that some data is probably not accurate; however, this gets stacked against the sheer overwhelming mass of data available, and the phenomenon does not go away.
I do not understand your mindset. Not really at a gut level, anyway.
Also, the more I read Watt, the more I see a problem with cherrypicking: his. He seems to carefully cherrypick bad examples, ignores data from "good" areas, ignores where changing circumstances in specific areas have balanced out so that effect is consistent in order to exaggerate inconsistencies, and seems to ignore entirely the efforts climatologists have made to compensate where there are real problems. He does the very thing he accuses the world's climatologists of doing -- engaging in "motivated reasoning" which systematically devalues anything which contradicts or weakens his position, in order to "prove a point."
Meh. The problem with spin is that it takes many hours of effort to dissect it and lay the problems bare, even when some of what he has said is completely inaccurate. I'm genuinely not impressed by agitprop, though, on *either* side of this debate.
Bruce et al,
While you go on with everyone else about the surface record, it should also be pointed out that you guys are wrong about the satellite record too. It does show warming. And the difference between the warming trends given by the two satellite data sets (UAH and RSS) is actually bigger than the difference between the trends of the surface data sets or between RSS and either of the surface sets (which might give you some idea of the relative certainty).
You can see them compared here: http://woodfortrees.org/notes
And while Arno is correct that satellites show the El Nino cycle more strongly, he is not correct to suggest that they show temperatures of El Nino, La Nina, and regular years have stayed the same. In fact, all temperature data sets agree that the 2008 La Nina year was warmer than any year before the 1997-1998 El Nino, including previous El Nino years. Oh, and all data sets agree that this is the warmest decade on record. Easily.
Oh, and Arno, you're also wrong about 1998 having ever been a lynchpin year used to "prove" global warming by itself. It seems a bit of a projection as it is a lynchpin year used to "prove" cooling by deniers.
Luna: "HOWEVER, I also notice that on the list of still active stations, more than 50% still appear to be rural, contra to your claim."
Not in the USA as of 2009. "Rural Area" is the designation to look for.
Where would you get such numbers? Are you making them up?
I said: "Luna, one last thing. Checking Texas and Washington, not one of the sites with 2009 are classed as "Rural Area"."
And you can accuse the author of the article on Watts site of "cherry picking", but he is dead on correct about GISTEMP using mostly Airports and Urban stations.
Maybe you could work through the list and find stations with 2009 data that are "Rural Area"?
I tried all states on West Coast ... none.
GISTEMP is cherry picking by dropping rual stations.
Eric, there are numerous cycles going on. The MWP was warmer than now. the Roman Optimum was warmer. Its been a lot cooler.
We are near the peak of Milankovich. Its probably has warmed a little since the last little ice age, and it has warmed a lot since the last real ice age.
Antarctica has been melting for 20,000 years (since the last ice age) excpet for the parts that cool like the interior has for the last 30 years.
It is the height of arrgoance to suggest a trace gas like CO2 has anything to do with the climate cycles.
Hell, even the slow steady ocean rise (going on for 20,000 years) stopped in 2006.
http://sealevel.colorado.edu/current/sl_noib_ns_global.jpg
Slight natrual warming doesn't worry me. Its the next inevitable ice age that does.
Let me get this straight, you've been going on about how the surface temp is all UHI and there's no reason to believe it's warmed at all, but then confronted with the fact that surface records match the satellite records as well as the satellite records match eachother, you decide the surface records, like the satellites, are measuring a quite real long-term cyclical change?
The MWP was warmer than now. the Roman Optimum was warmer.
You know, if you hear someone say that, you need to ask how much warmer, and when their study says "today" is. Oh, and also where.
We are near the peak of Milankovich.
That was 10,000 years ago. The long-term trend from 10,000 years ago to 1900 has been gradually downward, with some variation from century to century.
It is the height of arrgoance to suggest a trace gas like CO2 has anything to do with the climate cycles.
It is a straightforward consequence of well understood physics that CO2 causes warming.
Hell, even the slow steady ocean rise (going on for 20,000 years) stopped in 2006.
Looks like it "stopped" in 1998 and 1994 as well.
Eric, the question is not whether CO2 absorbs infrared radiation.
There are numerous questions about its ability to change the climate:
1) The mass of CO2 in the atmosphere is trivial, therefore how can it make much difference? The 360 parts per million warm up and then supposedly change the climate so much it dwarfs the effect of 1000ppm - 40000pm of the water vapor.
The 40000ppm is for water vapor in the tropics, over 100x the ppm of CO2.
2) Directionability. Say CO2 does absorb some infrared energy. Why does everyone suppose the heat goes down to earth and not out to space? Warmer air rises towards space where the energy radiates into space.
3) Other parts of air absorb energy at the same wavelengths CO2 absorb.
4) Clouds. A huge topic.
etc etc. The science is complex.
And the ability of CO2 to dominate climate has been proven completely wrong by the last 11 years of cooling.
1) ppm is not a measure of mass. Given the thickness of the atmosphere, any infrared photon heading away from the Earth's surface has plenty of chances to run into a CO2 molecule on its way. Also, its effect does not "supposedly" dwarf that of water vapor. However the amount of water vapor in the atmosphere is primarily determined by the temperature (which is why it's higher in the tropics), so water vapor will amplify warming caused by any other cause, such as CO2.
2) It's re-emitted in any direction. Half of it will be downward, and the other half might run into another CO2 molecule on its way up. Convection does not determine the direction it is emitted.
3) There are significant parts of the spectrum that do not overlap with that of other greenhouse gases.
4) Yes it is. That hardly makes it "arrogant" to suggest CO2 could change the climate, particularly given that the observed direct radiative changes from CO2 are greater than other changes in forcings (e.g. solar activity) that are believed to affect the climate.
The past 11 years don't give any statistically meaningful evidence of a reversal in the warming trend. The shifts between El Nino and La Nina years are larger than the temperature change caused by a few years worth of CO2 rise, but these variations average out when you compare decades, and this has been the warmest decade in every global data set, whether that's a surface temp data set or satellite.
The trouble with the CO2 theory is that it is demolished by perr reviewed papers like this one:
â(a) there are no common physical laws between the warming phenomenon in glass houses and the fictitious atmospheric greenhouse effects; (b) there are no calculations to determine an average surface temperature of a planet; (c) the frequently mentioned difference of 33 C is a meaningless number calculated wrongly; (d) the formulas of cavity radiation are used inappropriately; (e) the assumption of a radiative balance is unphysical; (f) thermal conductivity and friction must not be set to zero, the atmospheric greenhouse conjecture is falsified.â
http://arxiv.org/abs/0707.1161
Bruce, it is well known to the vast majority of:
geologists
physicists
astronomers
planetologists
climatologists
paleoclimatologists
etc.
why CO2 in the atmosphere works as a greenhouse gas, and physically and chemically why. Not only do we have the physics and chemistry of how a trace gas can act to retain IR in the atmosphere, no-one past the first month or so of a first-year undergraduate class in atmospheric physics would EVER be inclined to claim that greenhouse gases work by the same physical laws as a glass greenhouse. That paper has already been torn apart by a number of people, and the fact that you actually cite it as having some credibility simply exposes the fact that you haven't got any basic education in this area of physical science.
The Gehrlich paper itself is an object lesson in two principles:
1. it isn't just enough to expose your pet idea to peer-review, it must also survive peer-review (this paper doesn't)
and
2. It is dangerous for anyone to assume expertise outside their area of training.
"It is well known ... "
A fake consensus is not science. Liars like Mann are not scintists. The Hockey Stick is an out and out fraud.
"It is dangerous for anyone to assume expertise outside their area of training."
Which is why you cited all those professions that know nothing about climate as being onside the CO2 theory.
At least the paper I cited, was written by a physicist.
CO2 is a trace gas. So you warm up a trace gas. The warming is so irrelevant compared to the amount of energy absorbed by the oceans and the earth. It is so laughable that a theory demolished by no warming in the last 11 years is being cited by so many people.
The earth stays in balance because the warm air flows up thousands of feet and radiates excess energy into space.
The greenhouse theory implies warmed up molecules drop to the earth and warm up the oceans and ground. They don't.
In a real greenhouse, the glass traps the warmed air and prevents it from rising and radiatings its heat. Just like a car with closed windows gets a lot warmer.
The whole greenhouse theory is a joke.
The only thing it has left going for it is con games like GISTEMP and HADCRU where they drop all the rural stations to make it seem like the whole earth is warming. It is only airports warming a little.
Bruce, you really should have clicked the link Luna sent you. I have taken more than enough physics to understand the issues raised by the paper you cited, and it is garbage. For example, he just doesn't understand the second law of thermodynamics. Alternately, he knows it's nonsense and has written this to baffle laymen.
Just how much of that paper do you think you understood? For example, do you understand the laws of thermodynamics?
Yes, Science is not done by consensus, but nor is any science on this subject done by you. It is, what's the phrase... "the height of arrogance" to think the thousands of scientists working in a field you don't really understand well have all made errors as basic as the ones the paper alleges.
The greenhouse theory does not imply warm molecules drop to the earth. It assumes, correctly, that CO2 molecules that absorb infrared radiation will eventually re-radiate, in any direction. Yes, it doesn't work quite the same way as a greenhouse, which inhibits convection as well as radiation. If you're going to try to debunk the greenhouse effect, you should try learning what the theory actually says in the first place. I recommend http://cce.890m.com as a good primer.
I'm not sure I should bother getting into the Mann thing, as no one here cited him in the first place and that work really doesn't tell us anything about CO2's effect on the climate.
You've been completely unresponsive to my points on the temperature record, so I'm not sure why I would respond to you restating what you've already said a second time. You haven't actually presented evidence that non-airport locations haven't warmed. In fact, the surface and satellite records show warming has been strongest in the Arctic. Mountain snowpack isn't decreasing throughout the world because of airports. There are plenty of other natural indicators as well as satellites that confirm a long term warming trend.
Eric L, if by "completely unresponsive to my points on the temperature record", you mean I have totally demolished the land temperature record's credibility by pointing out that they have wilfully and deliberately dropped all rural stations in GISTEMP (in the USA) and made sure only airports and urban stations are used - then you are right. (and airports are over half of stations used in GISTEMP)
The USA had the most credible land temperature record in the world until it was destroyed.
Real scientists (as opposed to RealClimate scientists) would want a valid temperature record where rural stations dominate because most of the world is rural.
RealClimate scientists want a temperature record dominated by UHI contaminate airports and cities.
Roy Spencer points out, âwhen one takes into consideration that the early 1990s cooling from the Mt. Pinatubo volcanic eruption and the warming from the 1997-98 El Nino warming event were not part of any underlying long-term trend, globally-averaged temperatures were flat from 1990 until 2000, then there was a brief warming until about 2002, after which temperatures have once again remained flat. Note that the longer temperatures remain flat the greater the warming that will be required to put us back âon trackâ to match the climate model projections used by the U.N.âs Intergovernmental Panel on Climate Change.â
"From this simple morphological observation we can conclude that greenhouse theory is based on a misunderstanding of how the atmosphere works. The true nature of the troposphere was apparently evident to the Ancient Greeks who, used the word âtroposâ, to indicate that the air was âturningâ. The atmosphere is truly a vehicle for cooling the Earth. But for the atmosphere, the surface would be warmer. This would be so even in the absence of water vapour because the air absorbs warmth via simple conduction, that is, energy transfer by contact. The existence of water at the surface provides a powerful additional vehicle for surface cooling via evaporation, the most important limiting factor on the rise in surface temperature. The myth of a âgreenhouse effectâ dissolves in the cold light of careful observation. The atmosphere is no more effective in warming the surface than a greenhouse without a roof. An insulator (preserver of warmth) requires a vacuum, or, less efficiently, trapped air that can not be displaced by cold air from nearby. Unless you can properly trap and hold the air you will not conserve the warmth."
http://climatechange1.wordpress.com/2009/04/24/the-gaping-hole-in-green…
Bruce, the only thing you have "demolished" here is the last shreds of what little remained of your credibility. I doubt if there is anyone here but you who takes your version of physics seriously; if anyone IS that ignorant and deluded, I strongly suggest that they get more of a formal physics education, a path which I see you have declined for yourself.
I can tell you didn't bother looking at it before, but here again:
http://arxiv.org/abs/0802.4324
First you say there's been no warming this century, then you say that global warming stopped in 1998, now you say it started in 2000 and stopped in 2002. If you're right, you can't possibly be right. You apparently believe anything and everything that says global warming isn't real, even if it contradicts the rest of the stuff you believe that says global warming isn't real.
Erl Happ's theory is based entirely on processes that can't possibly warm or cool the Earth, but can only move heat from one place to another.
You haven't shown any attempt to quantify the effects of these alleged problems with the surface record. Incidentally, NOAA did that work, they found that using only stations that Watts' volunteers rated the best did not affect the temperature record. That is the sort of analysis Watts has never bothered to do. Perhaps if he had gone to college and gotten a degree in some science/math/engineering field he would know how. You haven't explained why the surface records match the satellite records as well as the satellite records match eachother. You haven't explained why allegedly airport-driven warming has been strongest in the Arctic. You haven't explained why natural indicators show warming (e.g., glaciers, or see here: http://agwobserver.wordpress.com/2009/07/31/papers-on-biological-indica…)
Roy Spencer would not agree with your take on the greenhouse effect. Or Happ's or Gerlich's. But I have to say, that is certainly a new take on the temperature record that I haven't heard before, can you post the link where you got that? You gotta love someone who can take a noisy data set with a long term trend in it and pick out the two years where the change really happened.
There is a growing need for transparency in the scientific process now more than ever after the CRU revelations. It has been shown that so many scientists, in all fields, rely upon so much computer modelling to validate their findings and that those within climatology are not skilled or diligent enough to execute computer programs.
Now these âclimatologistsâ admit in secret that there has been no global warming for over 10 years - a fact they chose to hide from the public that may be inferred to indicate some political agenda. Theirs is the mentality of tribalism where a clique becomes so extremely wedded to a fanatical belief in the righteousness of their cause that they will lie and implicate themselves in the greatest of criminal conspiracies â to needlessly wreck the worldâs economies.
Professor Jones and his alarmist team have operated as a cult. We can say âcultâ because of the extreme isolation of its members, the personal attacks on anyone who strays from the âcauseâ, and whereby unbelievers/outsiders are to be attacked and ridiculed.
Science is changing. As a safeguard against incompetence and corruption in future all climate data and computer codes should be freely publicly and never again should it take three years of freedom of information requests (FOI) before the facts become known. The idea that scientists can publish results without showing their computer code is now proven to be unacceptable in a modern world where science relies so heavily on computer calculations.
The good that Steve McIntyre and these leaked emails have done for climate science cannot be fully measured as yet, but it is must be considerable. But, the key point in this important issue is whether or not carbon dioxide (CO2) can cause the warming that is claimed by the IPCC and its scientists. According to Professor Jones âitâs a travesty it hasnât warmed,â Really, professor? So you wished a climate crisis on us all! We will now have to decide whether or not we destroy the global economy for a good reason or because of politics.
Too often in the past the conclusions of scientists had to be taken on face value because there was no way to easily access their meta data and source codes to see if they are even competent as programmers, let alone as climatologists. All it took for Professor Jones and his team to subvert criticism was to ensure he involved as many of his cult in the âpeer reviewâ as possible and not let on they fudged the computer programming. The cult relies upon trust among its followers and because the meta data and coding were hidden from publication the âpeer reviewâ was only ever about validating the conclusions, never about validating the methodology.
The very fact that specialist computer programmers who have looked that these leaked CRU emails are shocked at the ineptitude of the computing skills of climatologists reveals how difficult it is to achieve competence in computer data handling. But then all we need do is accept that there is a very short history to the science of climatology. Then we can begin to understand why it is so flawed. It is a fact that there is no such thing as a qualified climatologist. This is because there is no university on the planet that teaches even a basic degree in climatology â thatâs how new the science of climatology really is.
When you look at the big hitters in the field, people such as Professor Jones at the UEA, Michael Mann, James Hansen, none of these people possess degrees in computer science nor do they have degrees in climatology. They call themselves climatologist simply because someone pays them to do such work and then publishes their results. The âsomeoneâ in all this is invariably the deep-pocketed clique with a strong political agenda. Until climate scientists can prove they have more idea about data handling than âHarryâ the poor exasperated and self-trained amateur left on his own to screw up billions worth of key data.
The self-confessed failures of âHarryâ in the leaked emails proves no one can really have any confidence in the alarmist conclusions about man made global warming. âHarryâ privately admits so much of the data has been corrupted so that no reliable conclusions may be drawn from it. Professor Jones says he destroyed evidence to frustrate freedom of information laws. Jonesâ admissions prove that the peer review process has been corrupted. He is the prosecutorâs best witness that the CRU are guilty of malfeasance of public office.
Until this mess is properly sorted out there can be no further sensible debate on climate change and no Copenhagen Climate Treaty.
John O'Sullivan: I'll not go into all the howlers you have produced, but will give you a challenge:
Go to Gistemp and ModelE, and tell us what is wrong with the data handling there. Unless you can find a real mistake, I will expect you to apologise to Jim Hansen for making outrageously false comments about data handling because of ignorance.
@ Marco, no, please do enlighten me from my 'ignorance' as you are such a fan of Hansen's data handling methods you must also have great faith in his 'smoothing' techniques. Please explain to us all how that works. Because it seems to me that the GISS 1200km radius smoothing contributed more than 20% to the maximum global temperature rise over the term of January 1978 to April 2008. Or am I wrong?
http://climaterealists.com/index.php?id=2705
Perhaps you must be referring to another Jim Hansen? Because there is some clown named Hansen I'm familiar with who has stated that October 2008 was the "hottest on record". But it transpired he goofed after mixing September with October's record. A 10 degrees anomaly seems to indicate it is Hansen who should be dishing out apologies ; )
http://bobtisdale.blogspot.com/2008/09/gistemp-radius-smoothing-long-te…
@John O'Sullivan:
Please tell us why it is *wrong* to use one or the other smoothing method. And that's assuming Bob Tisdale has done the analysis correctly (he's known for making his share of mistakes, but somehow that does not cause you guys to say nasty stuff about him. Hansen on the other hand...).
Regarding the Hansen-bashing: please provide me with a link where Jim Hansen stated October 2008 was the hottest on record. You'll find exactly none. Also please learn the difference between a grant (hint: it's something you have to spend on the salary of *someone else* and/or research materials) versus getting money right in your pocket as extra 'salary'.
Marco, stop being an apologist for pseudo-science and corruption. Hansen's sandbox is GISS- anything coming out there has his fingerprints all over it and none of that stuff is reproducable by independent scientists. As for you *hint* on funding, I'd recommend a confidential little chat with someone in CRU's hockey team (*hint* don't email). Ben Santer has the answers on this...
From: Ben Santer
To: lbutler@xxxxxxxxx.xxx
Subject: Re: averaging
Date: Tue, 23 Dec 2008 12:08:14 -0800
Dear Lisa,
That's great news! I've confirmed with DOE that I can use up to $10,000
of my DOE Fellowship to provide financial support for Tom's Symposium. I
will check with Anjuli Bamzai at DOE to determine whether there are any
strings attached to this money. I'm hopeful that we'll be able to use
the DOE money for the Symposium dinner, and to defray some of the travel
expenses of international participants who can't come up with their own
travel money.
John O'Sullivan doesn't understand the e-mail he posts, but is that any real surprise?
@ dhogaza,perhaps it is you who doesn't understand what transparency and ethics mean. Let's see if you alarmists can understand a subpoena. Once we finally have it all out in the open from NASA GISS and CRU the courtroom inquisitions of the hockey team will begin in earnest over botched meta data, 'smoothed' data holes, faked proxies, dodgy grid cells in models, etc. then we shall see who laughs last - and loudest.
A full and thorough reading of those leaked CRU emails proves there came a stage when it was decided a data âfudgeâ was required. We know that Professor Jones admits that, â itâs a travesty its stopped warmingâ in response to a colleagueâs admission that âit hasnât warmed for ten years.â
We wonât know how much of a âfudgeâ actually occurred and how corrupted Jones and his team made the data until we see a full response to those subpoenas issued in the US against NASA. We certainly need answers to what algorithms were tried and then found wanting. We need to ask questions like, when did the data-culling start and finish? What criteria determined that certain proxy samples were unreliable? If it transpires that samples were omitted for no other reason than that they didnât confirm the hypothesis then we have proof of malfeasance and what has been manufactured for 13 years is not science but ideological propaganda.
At the moment, the biggest problem for man made warming advocates is that they havenât shown us the raw data and the methods they used to produce their âHockey Sticksâ. The emails uncovered recently indicate that their response to Freedom of Information requests was to delete them rather than reveal them. If you donât show your observed data, and all the algorithms (including computer code) used to produce your charts and graphs, so that other researchers can repeat your work and confirm it, you are not doing science.
Gee, John, grants used for a symposium, too. How shocking, it MUST be true that people will say AGW is true just to get a grant (which isn't based on a pre-conceived outcome...).
Also funny you incorrectly assign a quote to Phil Jones, and claim that no one can reproduce Hansen's result (hint: in this case Bob Tisdale actually DID reproduce the results...).
Finally: methods and algorithms are reported in the literature. That means people can easily repeat the work and confirm it when the data is available. 2% of lacking data means nothing, especially if you can reproduce many grids which are fully covered in the GHCN. The simple fact is that people who *claim* they merely want to check the data, do not have the ability to *understand* the data or the methodology.
The medical profession has discovered that a poison contained in a United Nations variant of fudge was the cause of a debilitating brain disease among scientists, now termed Climate Wars Syndrome (CWS).
The disease was secretly suspected by sceptical scientists to have spread rapaciously among the scientific community for two decades and to have taken a terrible grip over the reasoning powers of many. Victims can be identified by their green and alarmist complexion. Other side effects include an irrational hatred of mankind and a Tourette syndrome-like verbal abuse of anyone who uses fossil fuels. Threats of violence may occur. The world first learned of these sensational developments from the Internet on Friday November 20th 2009. The story broke that both the underlying cause of CWS and an effective treatment had been discovered by the due diligence of one man working at the UKâs Climate Research Unit (CRU). A vast community of Internet surfers soon memorialised these profound events by naming them, âClimategate.â
From leaked documents we understand that the catalyst for this epoch change in science occurred when a climatologist and self-taught computer programmer known only as âHarryâ was sat at his laboratory computer chewing on some fudge. Only after three long years working on this problem and in a sudden eureka moment, did it finally dawn on him. In Harryâs hands was the cause of brain fog mystery.
âF**k! Itâs the fudge! Itâs serial!â he cried.
Inadvertently, Harry has become the hero the public associate with solving one of the great mysteries of modern science. Since those findings have appeared on the Internet the world has quickly accepted that it was the UNâs foul fudge that caused scientists to suffer this dreadful disease.
Meanwhile, epidemiologists and clinicians have been quick to identify the hallucinagenic properties of the offending fudge to further unravel the mystery. Incredibly, the fudge has been found to contain a psychotropic substance that acts primarily upon the central nervous system where it alters brain function, resulting in changes in perception, mood, consciousness and behavior leading patients to feel delusions of grandeur and a sense of spiritual purpose in their lives.
It appears lone-wolf Harry, wiling away his time in the CRU laboratory subliminally faced the truth and by a process of âcognitive dissonance,â shocked himself out of the effects of the psychotropic intoxicant, a drug now known to cause the hallucinogenic appearance of a mythical beast known as, âMan-Bear-Pigâ (MBP). Other experts who have replicated Harryâs experiments confirm the efficacy of the cognitive dissonance reasoning process as a cure. Apparently, most recovering âaddictsâ (for this fudge-eating was clearly an addiction) soon notice a change starting with improvements in the appearance of their eyes which lose their tainted green colouration.
Other convalescing climatologists, that body of scientists identified as the worst fudge sufferers, are reporting the same side effects as Harry. Symptoms include anxiety, guilt, shame, anger, embarrassment, stress, and other negative emotional states that torment the patient. Epidemiologists have coined the name âClimate War Syndromeâ (CWS) to describe the fudge-induced malady. Both âClimategateâ and âClimate War Syndromeâ (CWS) have fast entered common usage giving a new handle on what was one of the great mysteries of our time.
Of course, like any serious disease, there will always be patients who wonât respond well to treatment. Those worst cases permeated with the deepest shade of green are believed to be James Hansen, Michael 'upside down' Mann and Phil Jones whom, its feared, may all need to be quarantined in isolation for several years.
Well, for the moment alarmists can pretend the leaked meta data won't be an even bigger fly in the ointment. So far we've seen only 65mb from CRU, the other 100mb is still to be analysed.
If there's more stuff like this ( below) I can see you people really getting the sweats with your CWS ( climate war syndrome).....
The following code is from the CRU code file osborn-tree6/briffa_sep98_d.pro , used to prepare a graph purported to be of Northern Hemisphere temperatures and reconstructions.
;
; Apply a VERY ARTIFICAL correction for decline!!
;
yrloc=[1400,findgen(19)*5.+1904]
valadj=[0.,0.,0.,0.,0.,-0.1,-0.25,-0.3,0.,- 0.1,0.3,0.8,1.2,1.7,2.5,2.6,2.6,$
2.6,2.6,2.6]*0.75 ; fudge factor
if n_elements(yrloc) ne n_elements(valadj) then message,âOooops!â
;
yearlyadj=interpol(valadj,yrloc,timey)
Even you green-eyed extremists can see this is blatant data-cooking, with no pretense otherwise. It flattens a period of warm temperatures in the 1940s 1930s â see those negative coefficients? Then, later on, it applies a positive multiplier so you get a nice dramatic hockey stick at the end of the century.
All you apologists weakly protesting that this is research business as usual and there are plausible explanations for everything in the emails? Sackcloth and ashes time for you. This isnât just a smoking gun, itâs a siege cannon with the barrel still hot
@John O'Sullivan: according to those who know IDL, the programming language that is used here, the semi-colons effectively make this a mute section, it doesn't do a darn thing.
Your gun barrel just exploded into your face...