Yesterday's quick rant had the slightly clickbait-y title "GPAs are Idiotic," because, well, I'm trying to get people to read the blog, y'know. It's a little hyperbolic, though, and wasn't founded in anything but a vague intuition that the crude digitization step involved in going from numerical course averages to letter grades then back to multi-digit GPA on a four-point scale is a silly addition to the grading process.
But, you know, that's not really scientific, and I have access to sophisticated computing technology, so we can simulate the problematic process, and see just how much trouble that digitization step would cause.
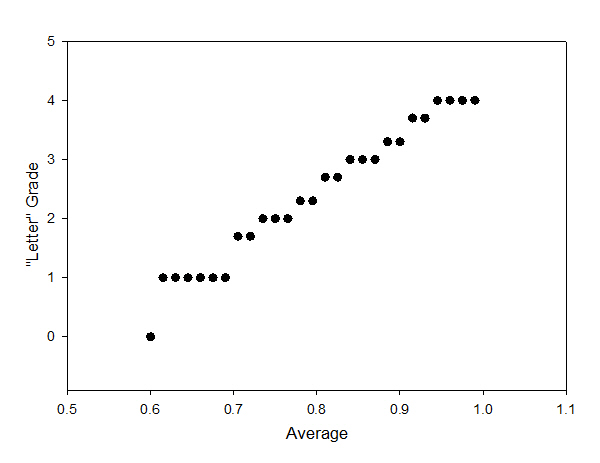
So, I simulated a "B" student: I generated a list of 36 random numbers with a mean of 0.85 (which is generally a "B" when I assign letter grades) and a standard deviation of 0.07 (not quite a full letter grade the way things usually shake out), then wrote a bunch of "If" statements to convert those to "letter" grades on the scale we normally use (anything between 0.87 and 0.90 is a "B+" and gets converted to 3.3, anything between 0.90 and 0.93 is an "A-" and gets converted to 3.7). The result looks like this:
I averaged these "letter" grades together to get a simulated "GPA" for this imaginary set of 36 classes (the minimum number required to graduate from Union). To get something directly comparable, I converted this "GPA" back to a decimal score using a linear fit to the step function data shown above.
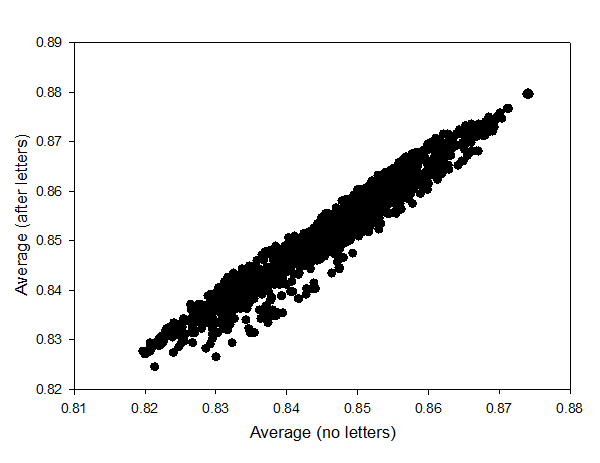
Then I repeated this a whole bunch of times, ending up with 930 "GPA" scores. And got a plot like this (also seen as the "featured image" above) comparing the "GPA" calculated from the "letter" grades to the average of the original "class average" without the intermediate letter step:
 Comparison of "GPA" for simulated B students with and without the intermediate step of passing through letter grades.
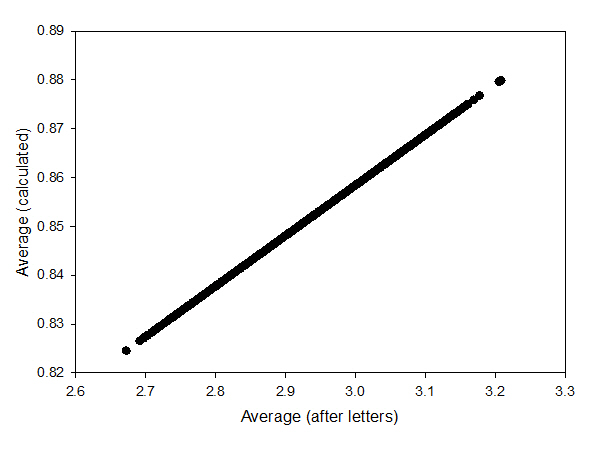
So, what does this say? Well, this tells us that the conversion to letter grades and then back adds noise-- if the two "average" grades were in perfect agreement, all those points would fall on a single line, like this sanity-check plot of the output of the conversion function:
The thicker band of points you see in the plot of the real simulation indicates that, as expected, the crude digitization step of converting to letter grades and then averaging adds some noise to the system-- the resulting "GPA" is sometimes higher than the "real" average without digitization, and sometimes lower. Usually lower, actually, because the fit function I was using to do the conversion skews that way slightly, but it doesn't really matter; what matters is the "width" of that band. Depending on the exact details of the digitization, a particular "real" average falls somewhere within a range of about 0.01-- a student with an 0.84 "real" average will end up somewhere between 0.835 and 0.845 after passing through the "letter grade" step. Or, if you want this on a 4-point GPA scale, it's about 0.05 GPA points, so between 3.00 and 3.05.
(The standard deviation of the distributions of scores are basically identical, but both a bit higher than the input to the simulation-- 0.110 and 0.111 for the original and after-letter averages, respectively. This is probably an artifact of some shortcuts I took when generating the 930 points you see in that plot, but I'm not too worried about the difference.)
How bad is that? Enh, it's kind of hard to say. The class rank that we report on transcripts certainly turns on smaller GPA differences than that-- we report GPA to three decimal places for a reason. So to the extent that those rankings actually matter, it's probably not good to have that step in there.
But, on the other hand, the right thing to talk about is probably comparing the noise introduced by the letter-grade step to the inherent uncertainty in the grading process, and in that light, it doesn't look so bad. That is, I'm not sure I would trust the class average grades I calculate for a typical intro course to be much better than plus or minus one percent, which is what you see in the back-converted average. The noise from passing through letter grades is probably comparable to the noise inherent in assigning numerical grades in the first place.
So, what about yesterday's headline? Well, from a standpoint of the extra effort required on the part of faculty who have to assign letter grades that then get converted back to numbers, it's still a silly and pointless step. But in the grand scheme of things, it's probably not doing all that much damage.
------
(Important caveat: These results depend on the exact numbers I picked for the simulation-- mean of 0.85, standard deviation of 0.07-- and those were more or less pulled out of thin air. I could probably do something a bit more rigorous by looking at student GPA data and my old grade sheets and so on, but I don't care that much. This quick-and-dirty analysis is enough to satisfy my curiosity on this question.)


The class rank that we report on transcripts certainly turns on smaller GPA differences than that– we report GPA to three decimal places for a reason.
Nobody seems to have commented on this point yesterday, so I'll bite: Who is the audience for the class rankings you produce? I understand why high schools push their computed GPAs to three decimal places: colleges often demand that they report a class rank. But what potential consumer of college transcripts demands this information? Companies will want to see evidence of competence based on grades in major classes. Grad schools will want that plus GRE scores. It might matter if you are picking a valedictorian and salutatorian, but it won't matter for most students.
If the college administration thinks that rankings are necessary, then yes, you do need that third decimal place. If you adjust GPA for plus and minus modifiers to grades, you get discrete steps of about 0.009 for 36 classes, and of course some students will have more courses (due to summer courses, five-year plans, etc.). But of course you will generate many ties in such a system, particularly if +/- modifiers aren't used. Even if they are, you have only so many possible results, and many of those never arise in practice (because a student with a GPA that low will be asked to leave rather than being allowed to graduate).
There is, let's call it "significant compression" of the scale when it comes to picking the valedictorian/salutatorian; I'm pretty sure that requires the third decimal place. And once you're ranking the top few, it's a simple matter to have the algorithm extend to everybody's transcript.
I think some professional schools may ask for class standing information-- I wouldn't put anything past medical school admissions offices, because they're all assholes, as far as I can tell. And I know some of the honor societies only take student who are in the top N% of the class.
Of course some institutions build a 9 point grading scale from 0 to 4.5 where 4 is an A and still compress, but a bit less. Of course this was from the 1970s and they only did gpa's to 2 decimal places, and since there were 4 graduating classes a year (one for each term) did not do valedictorian and salutatorian, as the sizes of the classes differed by term, the terms would be meaningless.
The institution did honor those who had all 4.0 or above with a dinner, as well has honor and high honor on the diploma. So the detail you report may be a function of a smaller school with essentially one graduating class a year.
We ran into an even more extreme case of bad grade averaging in our local school system. They instituted the following algorithm to calculate high school semester grades: Average two quarter grades and the final exam about equally, but only after first converting them all to letter grades. I would explain to whomever would listen that in the same class one student with grades 90, 90, 80 gets and A, but a student with 89, 89, 100 get a B, even though the first set averages to 87, while the second averages to 93. One noteworthy response was from a school board member, who when pressed to respond, demurred saying they were "not qualified to judge my mathematical argument."
Speaking from experience, medical schools definitely ask for your ranking. And for a decent percentage of them, the other part of your comment holds true.
I myself was not aware what GPA was until recently.It quite scary to know how the world grades your intelligence.