"Everything starts somewhere, although many physicists disagree." -Terry Pratchett
With a high unemployment rate and many people having stopped looking for work, it's pretty hard to live in the United States and not be aware of the struggles many people are facing. Here's a song by Loudon Wainwright III to set the tone,

But they also included the raw data used to generate this graph, and I thought it'd be fun to do a little analysis and see what else we can learn about income in the United States.
So I decided not to look just at the dollar amounts.

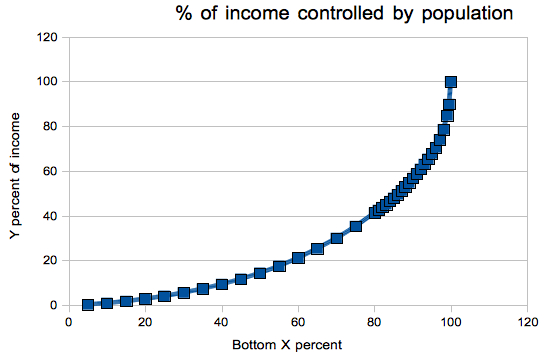
We can look at what percent of Americans control what percent of the total US income. And here are some interesting facts:
- The bottom 50% of Americans receive just over 14% of the total US income.
- That's less than the top 0.5% of Americans, who receive over 15% of total US income.
- It's worst at the lowest levels: the lowest 20% of Americans receive under 3% of the US income.
- If you split income in half, the bottom 87% of Americans receive half, while the top 13% receive the other half.
- And if you split it into thirds, the bottom 75% receive one third, the next 21% receive one third, and the top 4% receive the other third.
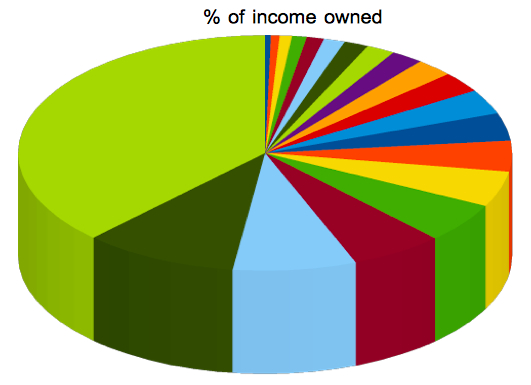
We can also break this up by percentage. Here's a pie chart showing what percentage of US income is received by the entire US population, in 5% increments.

The largest pie slice -- the top 5% -- receives as much income as about the first 16 pie slices, or the bottom 80% of Americans.
Now, I don't claim to know what a fair, sustainable, equitable income distribution looks like, or what the fairest system (i.e., tax code) is to obtain it, but it's also worth pointing out that the top tax rate -- 35% -- begins at income over $373,650.
This hits someone in the 98th percentile (making less than half a million dollars) the same as it hits someone in the 99.99th percentile (making around ten million dollars). Food for thought, at any rate. Have a great weekend, and hope you enjoyed the song and the pictures!

Do incredibly well paid physicists skew that data?
I think a tax system that matches income distribution seems fair. Let the the 0.5% of Americans that earn 15% of the income in America, pay for 15% of the US annual buget and National Deficit. That works out to about $34,000 each for the national budget and ~135K for the deficit. Now if they actually paid the 35% tax rate instead of deducting their way out of paying any taxes, I think America would be good to go. But with all the fresh TEA in congress, I'll wish in one hand and spit in the other and see which gets filled first.
Not seriously far away from the usual 1/f distribution.
Socialist agenda! Socialist agenda! Over 35% tax is EXACTLY what Marx had in mind.
Also, I love the comment about "incredibly well paid physicists." Nothing like working in academia to catapult you into the top 10 on Forbes's billionaire list. :D
Timely observations as we gather up our w-2's and 1099's to once again attempt to do our civic duty and cross through the valley of the shadow of IRS rules and regulations. The data is immediately skewed by omission since there are very many people who live quite well reporting little or no earned income at all.
I once asked a friend about how he handled the self employment tax alternative to paying social security and he just shrugged and claimed to have never had any "earned income" but has only income from passive investments. He has never "worked" in his life but does quite well doing whatever it is that he does. Social Security is a non-issue to him as well as members of certain religious groups that the IRS doesn't like to talk about.
Social Security, now there's one example of a very real tax that doesn't even show up in the given data set but hits the lower income group (at least the working ones) harder than the uppermost group, but really, the poor do benefit the most from it. If congress ever needs to grab more cash the fastest way is to increase the minimum wage!
Of interest: Sir Terry Pratchett was appointed Officer of the Order of the British Empire (OBE) "for services to literature" in 1998. In addition, he was knighted in the 2009 New Year Honours. His early interests included astronomy; he collected Brooke Bond tea cards about space, owned a telescope and desired to be an astronomer, but lacked the necessary mathematical skills. (Wiki article) The quote selected above is but one example of his most excellent wit. Good choice.
Scofflaws notwithstanding, consider that we already have something of a de facto flat tax:
http://articles.moneycentral.msn.com/Taxes/Advice/YourRealTaxRate40.aspx
Lies, damn lies, and statistics!
A bit of information some may find useful left out of this, the amount of the total of government tax revenue that is paid by just that top 5% wealthy.
http://www.taxfoundation.org/news/show/250.html
So the question is, do you wish to tax individuals based on what is equal for the individual? Or do you want to tax based on the benefit to society, or from those according to ability and to those according to need?
@Jeremy
Careful with your wording. It is not the amount of total tax revenue but of federal INCOME taxes. This data leaves out payroll taxes which hit the poor much harder.
What's the definition of "income" here? Is it all income, or only income liable to income tax? Is it including dividends and capital gains?
@Lena,
Something like 40% of the lowest earning tax payers actually recieve more back in income tax credits than was withheld in during the year. So really that top 5% is paying back the taxes paid in by the bottom 40%. There is no arguing that the tax load is on the backs of the wealthy. You can rest assured they are not collecting the government entitlements that now over 50% of Americans collect.
There's an interesting variable that looks at this in a way that I think works well for comparing one country's inequality to another. Called the Gini Coefficient, http://en.wikipedia.org/wiki/Gini_coefficient, it is far from perfect, but it does allow something of a quantitative comparison.