
"All the evidence, experimental and even a little theoretical, seems to indicate that it is the energy content which is involved in gravitation, and therefore, since matter and antimatter both represent positive energies, gravitation makes no distinction." -Richard Feynman
It was a big last week at Starts With A Bang, and you might not realize it but next week is shaping up to be even bigger! If you missed anything, here's what we took a look at:
- How do black hole jets carve out bubbles in space? (for Ask Ethan),
- Beyond human vision, distant galaxy clusters emit spectacular fireworks (for Mostly Mute Monday),
- What your birthstone means, according to science,
- The Milky Way's most recent supernova was hidden, until now,
- A nearby, infant star teaches us how planets begin to form, and
- How fast does Earth move through the Universe?
That's quite a collection, but there's more! For those of you who love podcasts, thanks to our Patreon supporters (some of you included!) I'm pleased to share with you our sixth podcast: on the most distant galaxy (so far) in the Universe!
Large scale projection through the Illustris volume at z=0, centered on the most massive cluster, 15 Mpc/h deep. Shows dark matter density overlaid with the gas velocity field. Image credit: Illustris Collaboration / Illustris Simulation, via http://www.illustris-project.org/media/.
From Alan L. on dark matter and whether it's displaced by normal matter: "'the idea that dark matter is displaced by normal matter runs counter to the evidence that dark matter appears where normal matter does.'
Except, apparently, in the vicinity of the world’s ever expanding collection of increasingly sensitive dark matter detectors."
The dark matter detectors you refer to -- all of them -- rely on three very specific assumptions:
- That dark matter has a substantially non-zero interaction cross-section with normal matter through either the weak or electromagnetic interactions,
- That dark matter is of a particular variety and a particular mass,
- And that the combination of the cross-section and scattering amplitude means we'll have an event rate above the background of neutrinos, neutrons, cosmic rays and so on.
 Image credit: Xenon-100 Collaboration (2012), via http://arxiv.org/abs/1207.5988. The lowest curve rules out WIMP (weakly interacting massive particle) cross-sections and dark matter masses for anything located above it.
The fact that there's a null result from all such detectors designed in this way likely tells us that whatever the cross-section of dark matter is, it's below what these detectors can detect. It may indicate that dark matter isn't the class of matter these detectors are looking for. The idea that dark matter is displaced by normal matter has no evidence for it, and is just another "let's make an unmotivated assumption with no way to test it" (i.e., a bad idea) that we can't rule out. It's important to keep it in mind, but keep it waaaaay in the back of your mind, where it belongs.
The effect of El Niño on monthly temperature, where red indicates a boost and blue indicates a dampening (averaging over the full year gives the 0.09C figure). Image credit: Dr Thomas Cropper, University of Sheffield. Adapted from Foster & Rahmstorf (2011) using NASA Gistemp data up to 2015.
From Denier on global warming and El Niño: "You seriously believe the El Niño conditions only contributed 0.1° C? Seriously?!?"
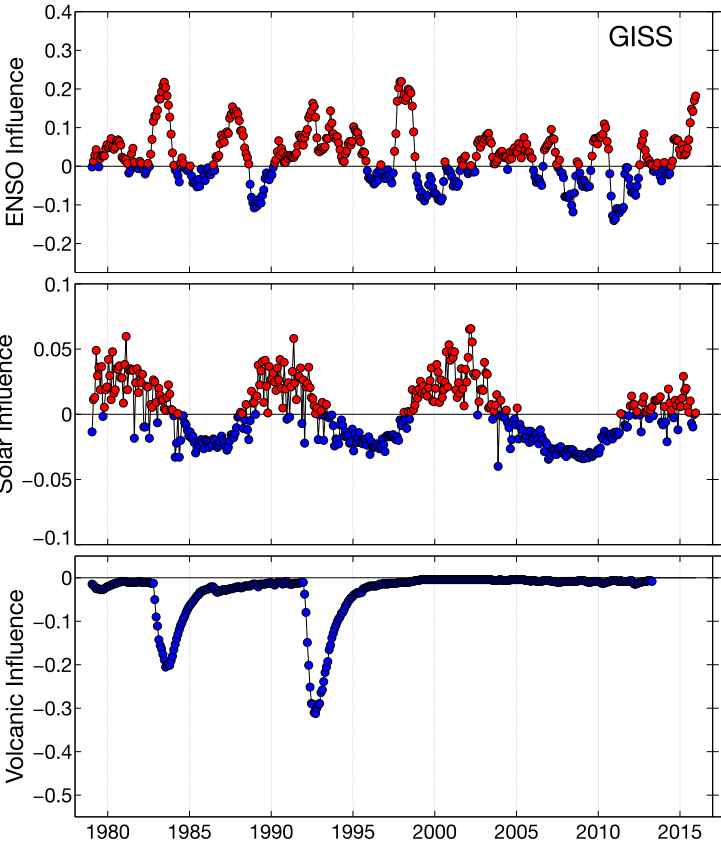
Well, yes, in the sense that one "believes" the conclusions that scientists who are experts in the field draw. According to the best reconstructions I've seen, the figure is 0.07 +/- 0.03° C, with the warming effects only really impacting the September/October temperatures and onwards. But that's me "parroting" what the actual scientists said, and I consulted a number of those scientists when I wrote my article in the first place. They signed off on it and told me I had it correct, but if you doubt their scruples and their work, then your doubt will trickle down to my writings as well. According to NASA's GISS, the mean influence of El Niño is 0.09° C for the 2015 year (within the errors of aggregate estimates), but based on how El Niño worked in 1983, 1987/8, and 1997/8, we can expect the El Niño contribution to be sustained and larger for the present year: 2016.
From Omega Centauri, dissatisfied with spherical heating from linear jets: "That was unsatisfying. The gas responds primarily because it get heated, and one would expect the heating would need to be spherically symmetric in order for the “explosion” to be spherically symmetric. Now I think it should be intuitively obvious that the jet will simply blast through the gas, so whatever else happens we have holes punched out by the jets. Then the problem becomes one of explaining why the rest of the energy is deposited in the gas in a roughly spherical manner."
I want to show you a different simulation: one of a supernova conflagration event beginning from an off-axis point in the core.
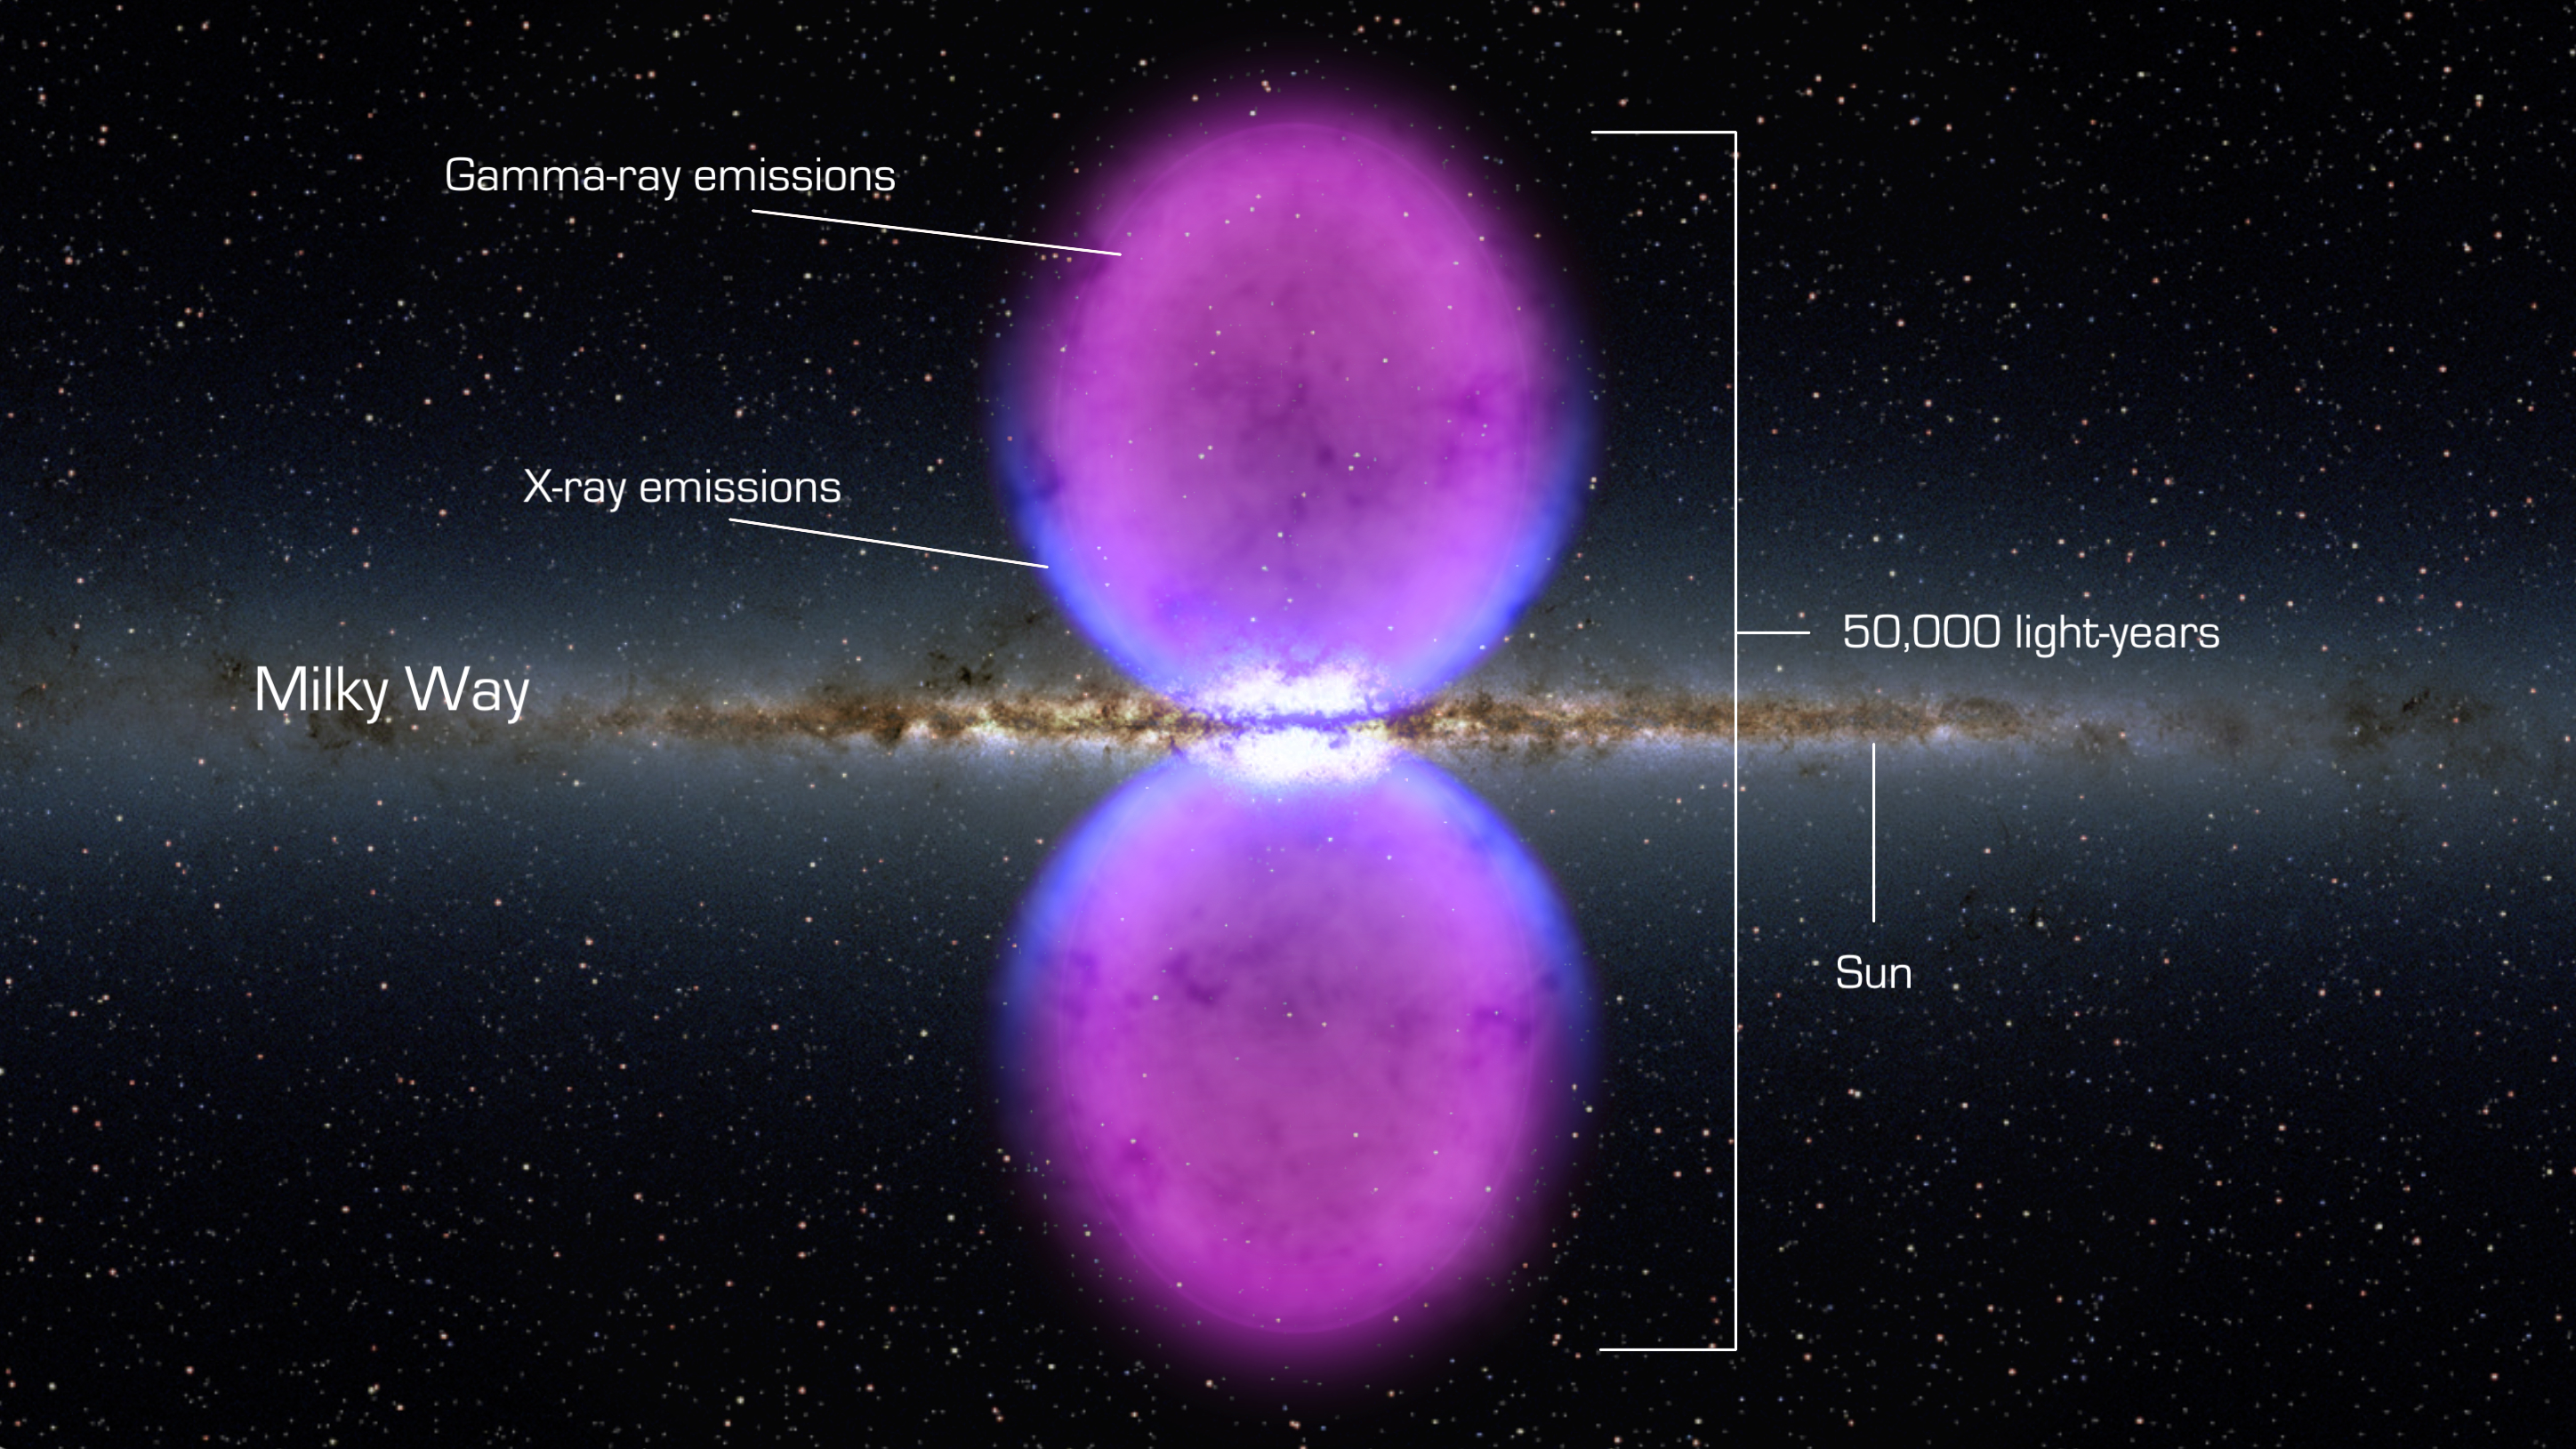 Image credit: NASA's Goddard Space Flight Center.
Which is what we see in the X-ray and gamma-ray part of the spectrum, even around our own Milky Way!
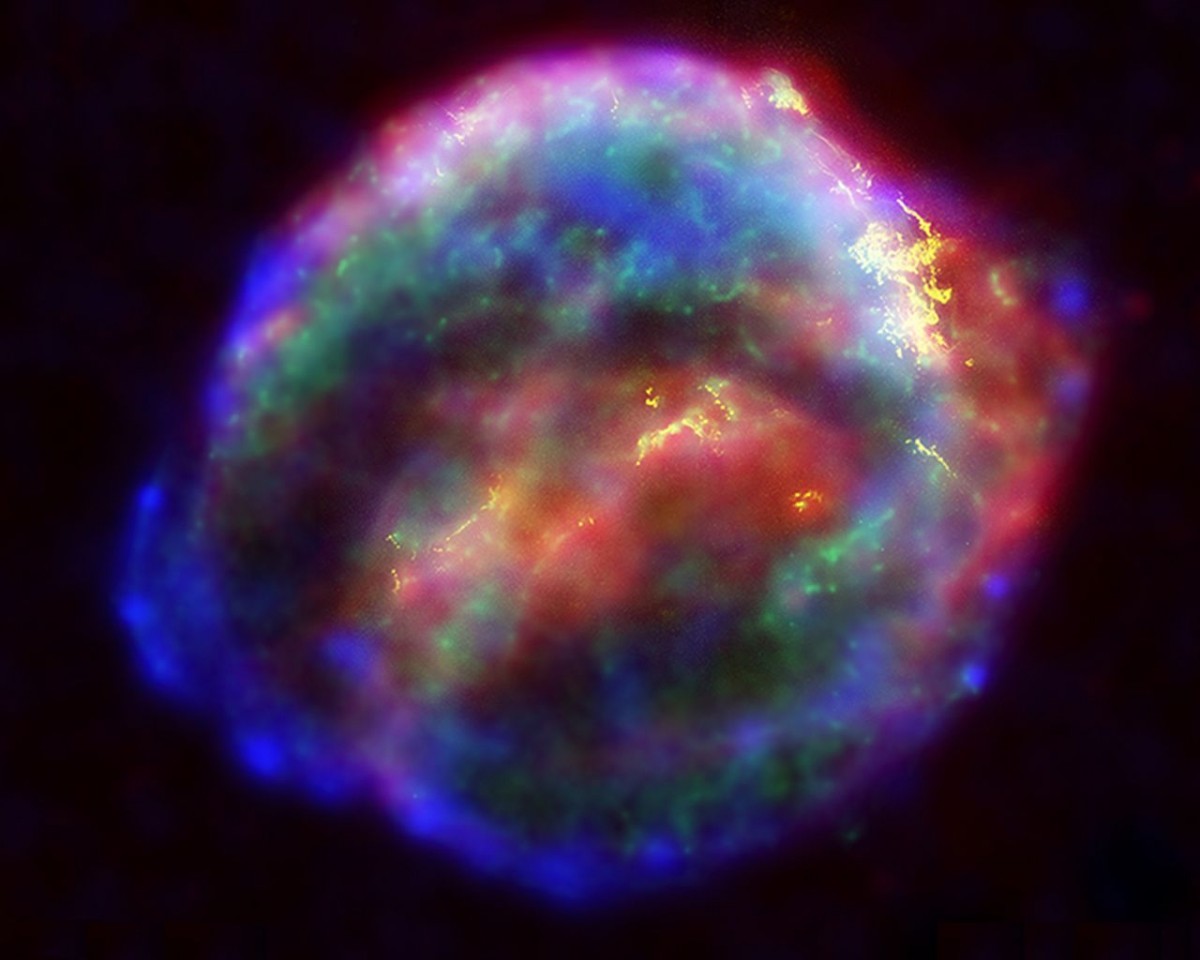 Image credit: NASA/ESA/JHU/R.Sankrit & W.Blair, of an optical/IR/X-ray composite of the 1604 supernova remnant.
From Denier on Kepler's supernova(e): "For some reason I didn’t realize the star Kepler caught going supernova wasn’t in the Milky Way."
That's because there is a big difference between "Kepler's supernova" above, which occurred in 1604 and was attributed to Johannes Kepler, the day's top astronomer, and the supernova that Kepler (the spacecraft) spotted in its field of view.
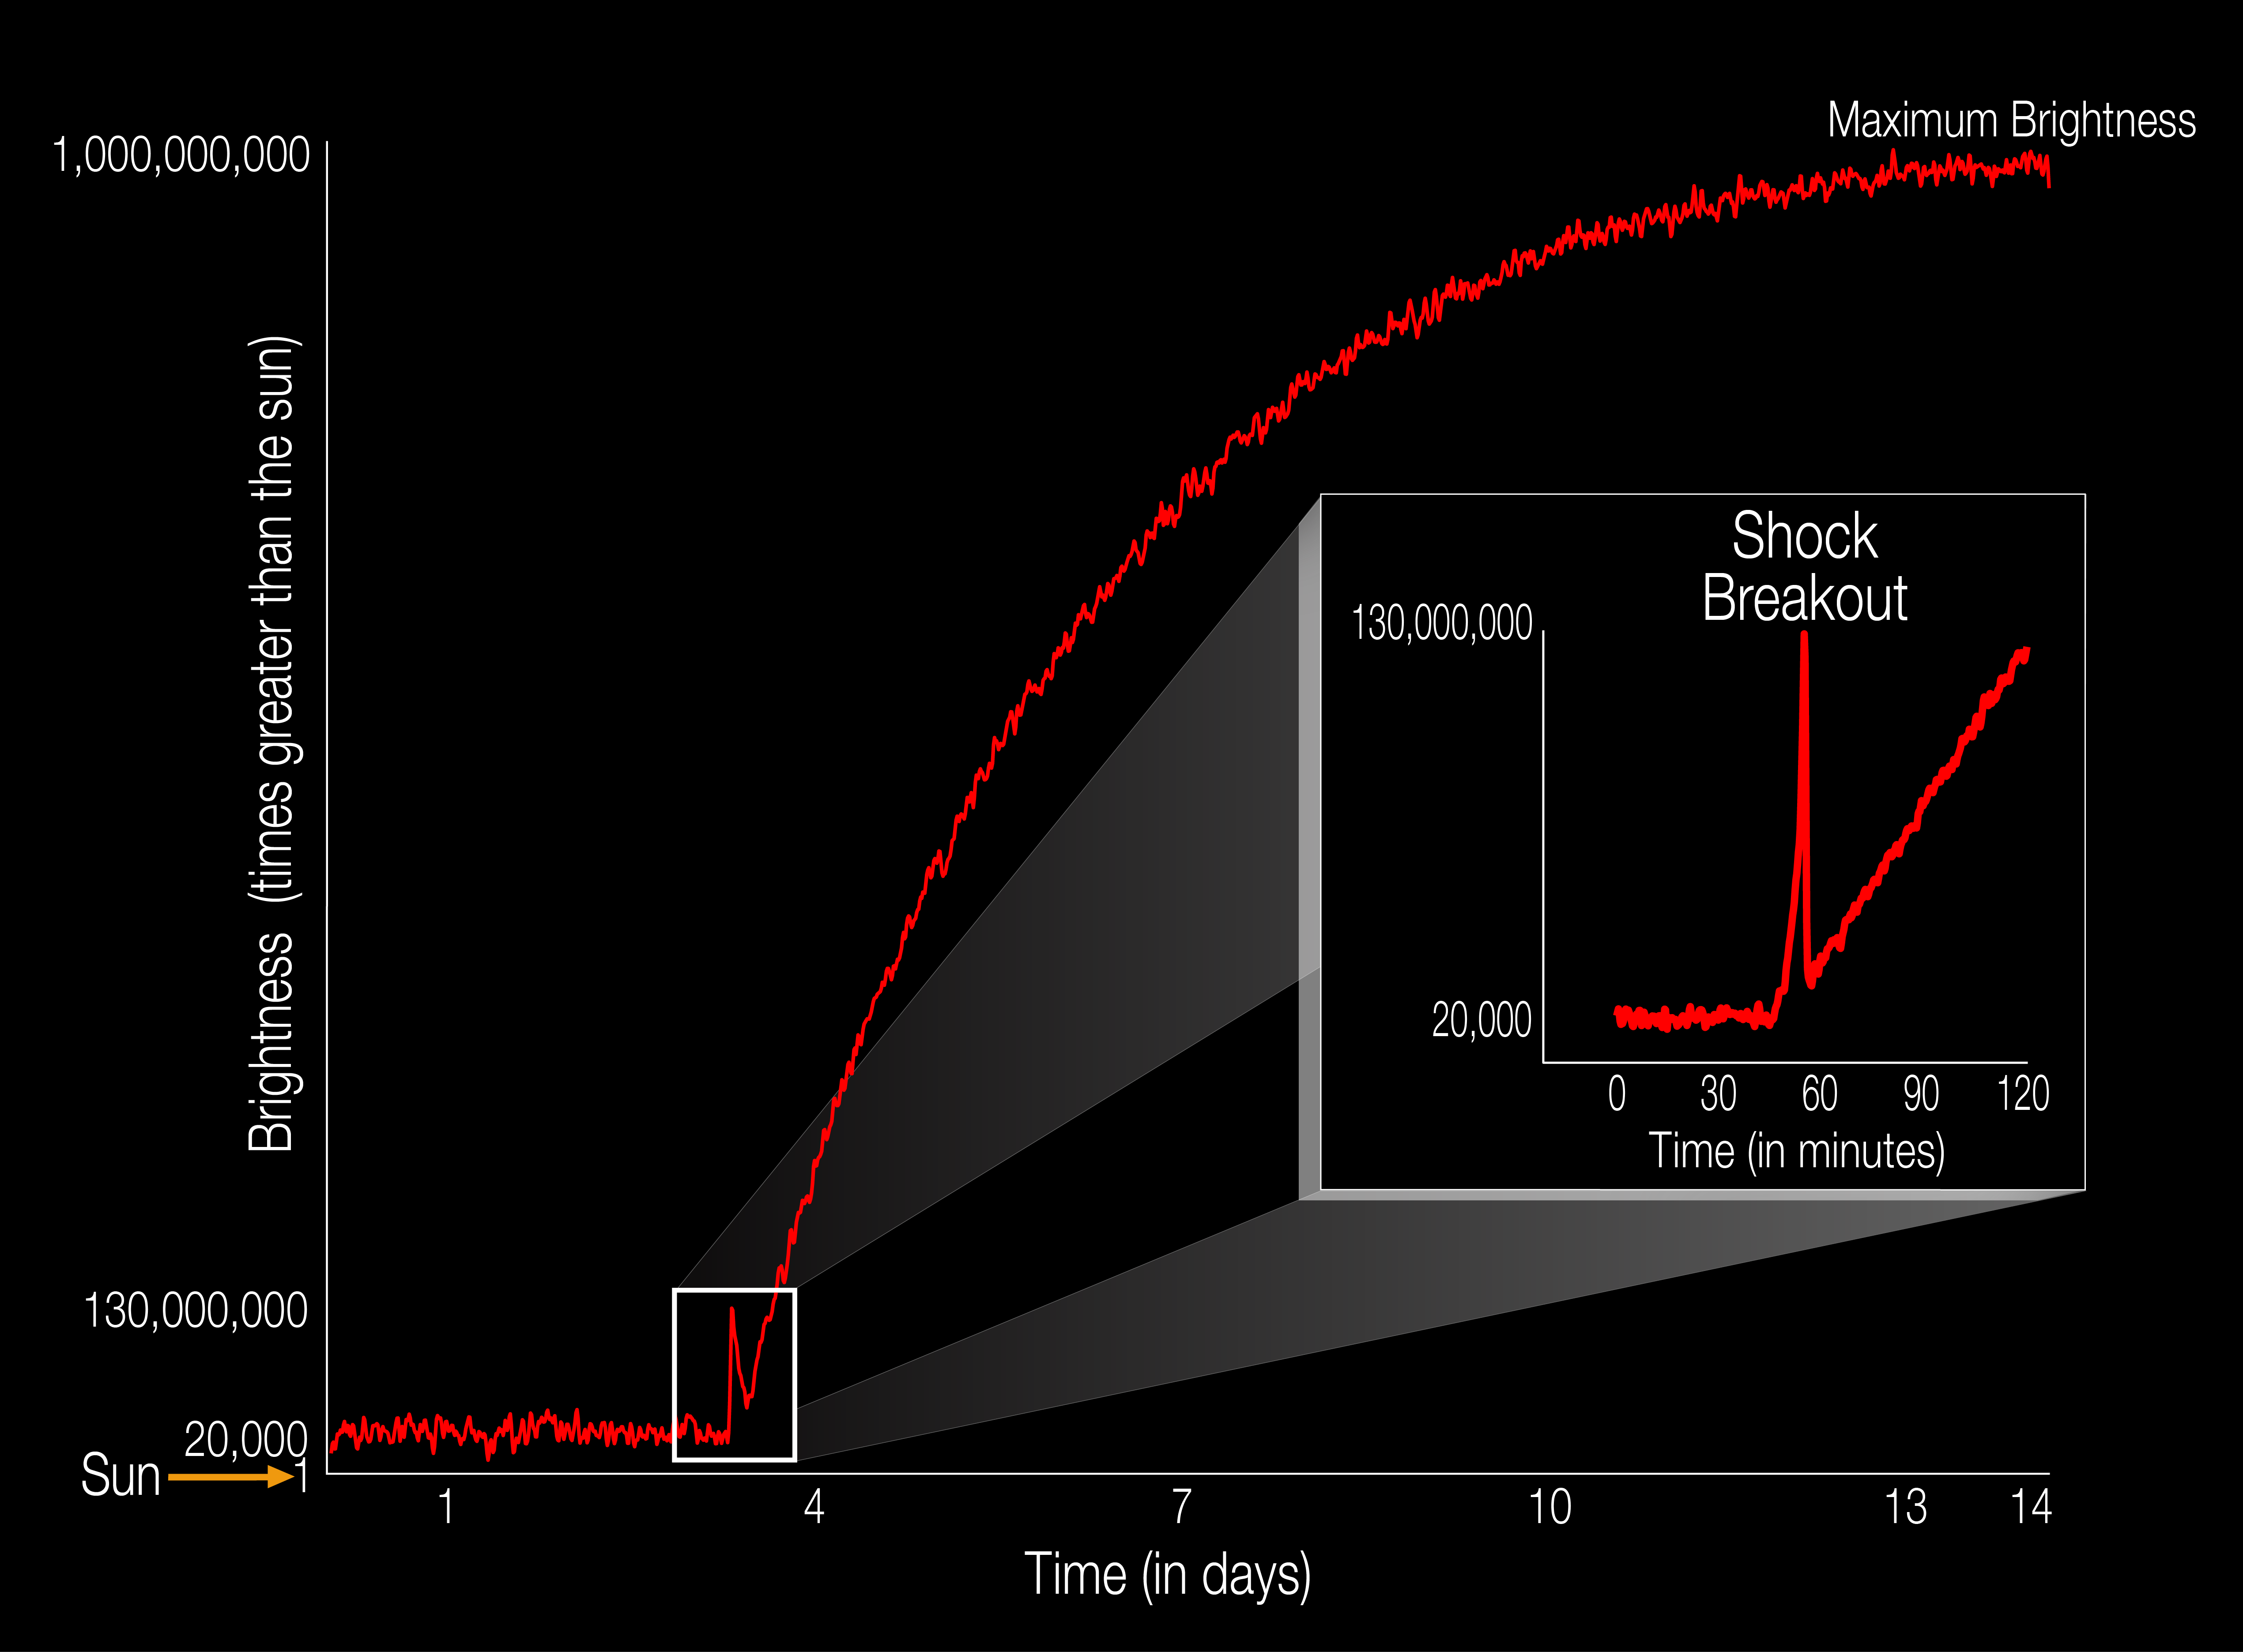 Image credit: NASA Ames/W. Stenzel.
We've never seen an initial flash like this, but what's worth noting is that it gets an additional ~8 times brighter than this flash gets it to, which tells us that supernovae are practically instantaneous for the nuclear explosion, but when it comes to the light, they aren't these instantaneous processes we think of. Pretty interesting!
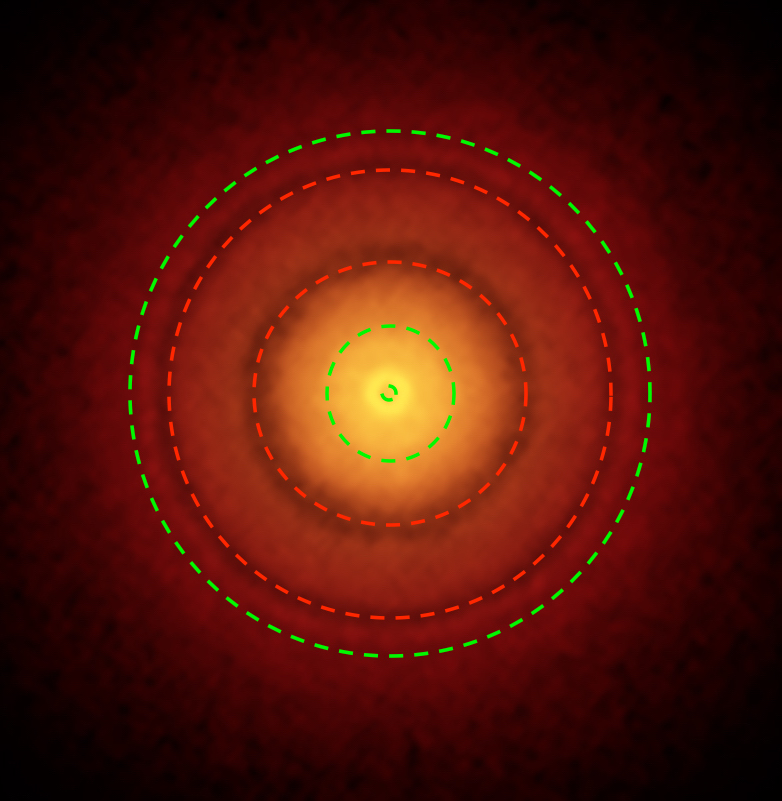 Image credit: S. Andrews (Harvard-Smithsonian CfA); B. Saxton (NRAO/AUI/NSF); ALMA (ESO/NAOJ/NRAO), of the protoplanetary disk around TW Hydrae. Annotations by E. Siegel.
From Michael Kelsey on the discovery and new measurement of the protoplanetary disk around TW Hydrae: "In addition to the ESO version (10 Mar 2016), the “as submitted” paper from 30 Mar 2016 is up on arXiv, http://arxiv.org/abs/1603.09352"
The biggest takeaway from the paper -- and anyone who wants to read it, it's free and complete in the link Michael provided -- is not that there's an "Earth-like" planet in there, as many people have (erroneously) reported. The big thing you want to look for is gaps and empty spaces in the dusty disk around the star. In addition to the ones I've highlighted (which may be planets, planetesimals or merely illusive phantasms), there's pretty good evidence for a number of features at ~6, 13, 23, 38 and 43 A.U., in addition to a definite lack of dust altogether below 1 A.U.
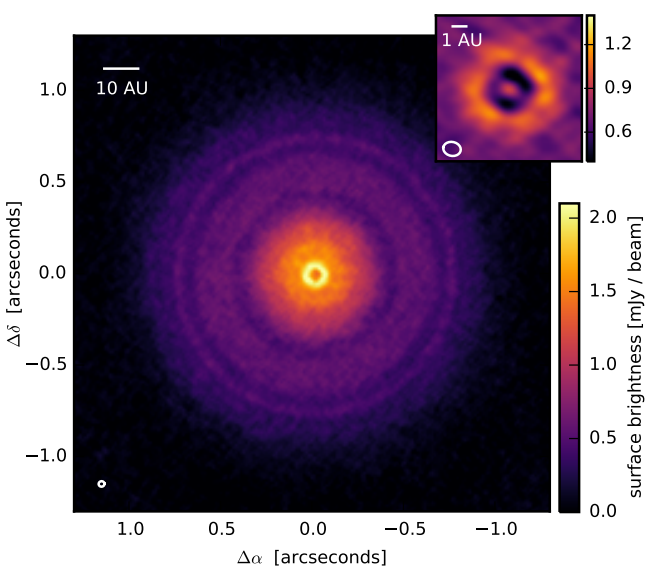 Image credit: S. Andrews et al. (2016), via http://arxiv.org/pdf/1603.09352v1.pdf.
The empty spot may indicate a planet or many planets; it may indicate a rocky planet or a series of rocky planets or a series of super-Earths or a mix of rockies and super-Earths (but not gas giants; they would show up on their own). But the coolest thing that we learn from this is that planet-containing inner Solar Systems are common even from the earliest times! Now, it's time to get to higher-resolution on this so we can find more of them farther away, and figure out what's happening in here!
Image credit: Cosmography of the Local Universe/Cosmic Flows Project — Courtois, Helene M. et al. Astron.J. 146 (2013) 69 arXiv:1306.0091 [astro-ph.CO].
From See Noevo on how fast Earth moves through the Universe: "I guess the answer is: many different speeds.
The earth’s speed
– orbiting the sun,
– revolving in our galaxy,
– moving in the local groups,
– and inflating into a bigger universe.
What is our speed for the last?"
![Image credit: Cosmography of the Local Universe/Cosmic Flows Project — Courtois, Helene M. et al. Astron.J. 146 (2013) 69 arXiv:1306.0091 [astro-ph.CO].](/files/startswithabang/files/2016/04/cosmicflows.png)
By "inflating into a bigger Universe" you clearly mean relative to the rest-frame of the cosmological expansion, which you clarified in a later comment. What's odd about asking this is that every question you asked is answered in the article. But in case you missed it:
- 30 km/s,
- 220 km/s,
- our Milky Way moves towards Andromeda (relatively) at 300 km/s,
- our local group moves through space at a total of ~627 km/s,
- and we move, all total, relative to the CMB at ~368 km/s.
![Image credit: The pre-launch Planck Sky Model: a model of sky emission at submillimetre to centimetre wavelengths — Delabrouille, J. et al.Astron.Astrophys. 553 (2013) A96 arXiv:1207.3675 [astro-ph.CO].](/files/startswithabang/files/2016/04/dipole.png) Image credit: The pre-launch Planck Sky Model: a model of sky emission at submillimetre to centimetre wavelengths — Delabrouille, J. et al. Astron.Astrophys. 553 (2013) A96 arXiv:1207.3675 [astro-ph.CO].
Image credit: The pre-launch Planck Sky Model: a model of sky emission at submillimetre to centimetre wavelengths — Delabrouille, J. et al. Astron.Astrophys. 553 (2013) A96 arXiv:1207.3675 [astro-ph.CO].
The determination of the velocity of the local group requires measurements of all the other quantities in 3D space, by the way. They all have uncertainties, the largest being the uncertainty of the Sun's motion around the galactic center, which is on the order of ~20-25 km/s. But the total figure, from the CMB, has an uncertainty of only ~2 km/s.
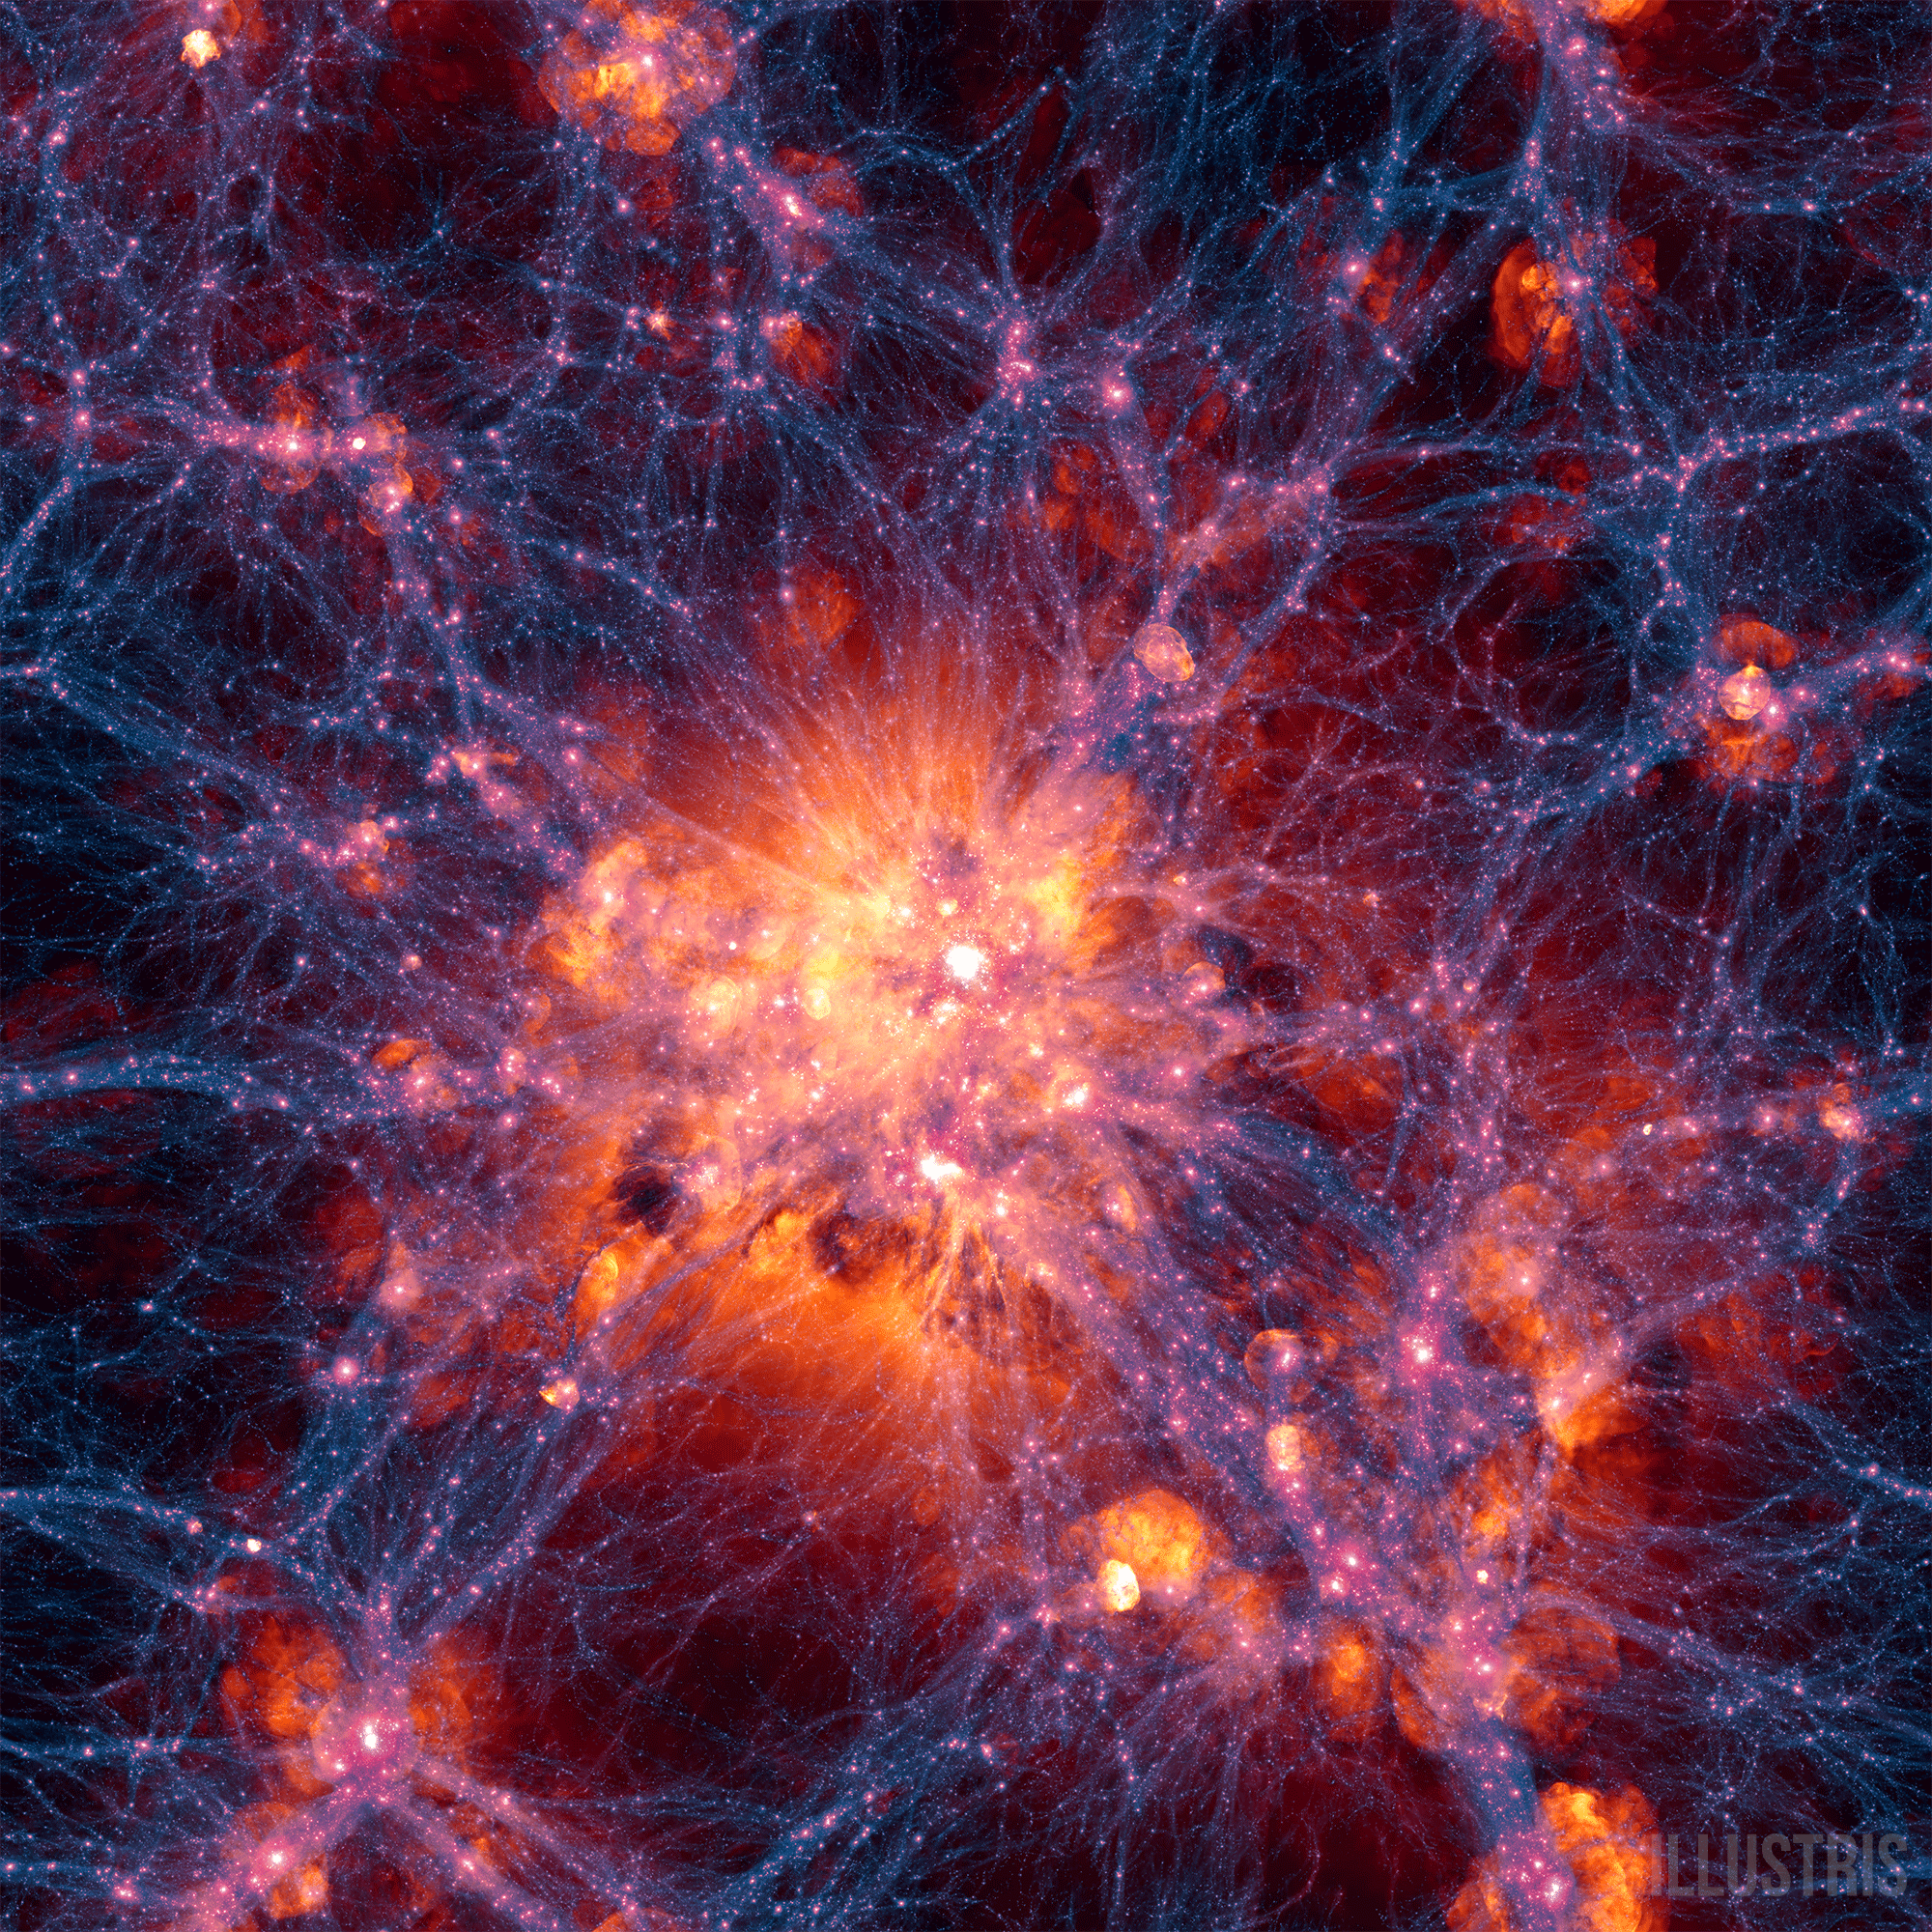
Image credit: The Millenium Simulation, V. Springel et al., of the cosmic web of dark matter and the large-scale structure it forms.
And finally, one more from our buddy See Noevo in the general category of misunderstood things about the Universe: "I understand that the *FLRW metric* assumes the universe is *isotropic.* If that’s so, it doesn’t make sense to me, because, obviously, the universe *does* look *different depending on where you are in the universe*."

Yes, the FLRW metric does assume the Universe is isotropic.
No, isotropic does not mean "the Universe looks the same from all locations." That's what "homogeneous" means, which the FLRW metric also requires. Isotropic means the same in all directions.
But the Universe does not look different on large scales depending either on where you are or what direction you look in. The large-scale density contrast is tiny, on the order of ~0.003%.
The Universe does look different when you look back in time, but that is because of -- wait for it -- the fact that the Universe has only been around for a finite amount of time, and because given enough time and physical laws, physical systems evolve. So, See Noevo, i.e., see no evolution, I understand that you come at this from an ignorant viewpoint: without the knowledge to decide what's correct and what's incorrect. I (and many other commenters here, including Michael, whom you wrongly deride) am providing you with that information that you're seeking, and it gives you the information you need to make those determinations for yourself. You can stick to your guns, but if you do, you move from the point of view of ignorance to one that has only ever been accurately described by the wise words of Dale Gribble.
 Image credit: Busted Tees, and King Of The Hill.
Do better than that. You know you can, I know you can, and everyone here knows you can. Come on; it's time to take the years of information you've been provided, put them together and solve this puzzle for yourself.
Thanks for a great week, everyone, and I'll see you back here tomorrow, where we'll kick off with a spectacular exclusive: an interview with the executive director of LIGO!
@Ethan
Lets get this out of the way right up front: It is not an issue of doubting your scruples or those of your colleagues. That is a BS charge. It is that I believe academia can be an echo chamber and especially so at your school where even the law department seems geared toward environmental justice.
So long as you are checking with experts in the field, I have one question for you to keep in mind for next time:
You have written words to the affect of when you look at periods of time longer than 17 years so as to eliminate the short term variability that weather causes, the correlation between the rise in global temperature and rise in CO2 becomes evident. Why is the same treatment NOT given to the correlation between rising CO2 and falling humidity*?
In the original thread are links to statements made by Dr Roy Spencer of UAH, John Cook of Skeptical Science, and Carl Mears of RSS all acknowledging the falling humidity, its impact, and the collective failure of the climate science community to definitively explain it.
It is important because all of the climate models require a positive water vapor feedback to create their predicted warming signal. The predictions are all high largely because water vapor is stubbornly refusing to cooperate.
As a scientist who prides himself on looking at all the scientific data, and has colleagues who are experts in the field, it might be good to check their certainty on that hugely important aspect before letting their false confidence trickle down into your work. No offence intended, I'm just sayin'.
* - The radiosonde humidity data is from the NOAA Earth System Research Laboratory
Before you through another red herring, do you now acknowledge the estimate was accurate or not?
If not, what is your exact reasoning and what data are you going by to conclude that it is significantly inaccurate.
Before you throw*
Obviously...
"It is that I believe academia can be an echo chamber"
And the people in the crowd said "Amen!"
Now see this graph:
http://realclimatescience.com/wp-content/uploads/2016/03/Screenshot-201…
Now see this:
https://i2.wp.com/realclimatescience.com/wp-content/uploads/2016/03/CX6…
Commentary:
"Contrary to the endless lies of government climate scientists, there has been little or no troposphere warming since 1990. There was also no troposphere warming from the 1950s to 1990 or 2000.
The thread is from here:
https://stevengoddard.wordpress.com/2016/03/31/little-or-no-global-warm…
For frick sake It's right there...
You can count me out on that last bit.
"Do better than that. You know you can, I know you can, and everyone here knows you can."
Yeah, I'm with Narad. That's the first thing you've posted on this blog that has zero supporting data.
@surething #2
There are three aspects here:
1 - I acknowledge @Ethan found scientific work.
2 - I do not acknowledge the work as robust enough to be called 'fact'. Call it a reconstruction, a claim, an estimate, or whatever, but it is not a fact.
3 - I do not accept the conclusions in the cited work due to historical observation.
The strong El Ninos in 1982-83, 1997-98, and 2015-16 were all 0.5 degrees C or more over the trend line. Even the moderate El Ninos of 1972-73 and 2003-04 were at least 0.4 degrees C over the trend line. Observational evidence make the claim of a 0.1 degree bump this go-around beggar belief.
What trend line is this exactly?
The 1997-98 El Nino wasn't 0.5 degrees C over any year since 1985. Since 1985 it had already gone up by about half that amount (0.25 degrees C) leaving at most another 0.25 degrees C that the El Nino could be responsible for.
"Lets get this out of the way right up front: It is not an issue of doubting your scruples or those of your colleagues. That is a BS charge. "
Yeah, right, they're lying because they don't know better...
Sure.
"It is that I believe academia can be an echo chamber and especially so at your school where even the law department seems geared toward environmental justice. "
Says someone who gets all their information from the denier echo chamber...?
It COULD be an echo chamber. Prove it. Don't assert it. The WTFUWT echo chamber CAN be proved. Just look at how the same tired old memes keep living there.
And look what happens when even "one of their own" don't toe the echo.
"when you look at periods of time longer than 17 years"
I call CHERRY PICK! And it's another echo chamber proof of denierdom.
"Why is the same treatment NOT given to the correlation between rising CO2 and falling humidity*?"
There is. Just that the denier echo chamber will only accept "AGW is wrong" as the result from ANY treatment of a cherry pick they concentrate on.
"and the collective failure of the climate science community to definitively explain it."
And nothing from you or any of the deniers about whether this changes anything.
Moisture is increasing in the atmosphere, and the RH is dropping only in areas where there wasn't much water anyway, its effects negligible, and of no visible importance to the predictions, never mind the theory itself.
"It is important because all of the climate models require a positive water vapor feedback to create their predicted warming signal."
And your whine has nothing to say about it. IT IS IRRELEVANT. Do you not even care that water feedback and relative humidity are different things entirely???
"The predictions are all high"
Lie
"largely because water vapor is stubbornly refusing to cooperate."
Lie.
"self on looking at all the scientific data, and has colleagues who are experts in the field, it might be good to check their certainty on that hugely important aspect before letting their false confidence trickle down into your work. "
You need to follow that yourself.
"And the people in the crowd said “Amen!”"
Yeah, but we know your beliefs are all whacked out crazy.
"There are three aspects here:"
No, there is one.
Before you [throw] another red herring, do you now acknowledge the estimate was accurate or not?
Throwing out THREE red herrings does not constitute part of the reality of rational discourse.
"2 – I do not acknowledge the work as robust enough to be called ‘fact’."
Based purely on what you want to be true, and denial of reality.
"3 – I do not accept the conclusions in the cited work due to historical observation"
Nope, not due to that, since it would destroy your denial, just like it did all the others skeptical of Svante's work 100 years ago. THEY, however, were scientists and skeptics, not deniers.
@Wow #9
That is because you don't know what you are talking about. The 17 year minimum used by both sides was from "Separating signal and noise in atmospheric temperature changes: The importance of timescale" by Benjamin Santer et al.
...and how often do you see me citing WUWT? It must really needle that you've got all these canned responses that don't relate to what is actual said. :)
@surething #8
While I think the colorful graphic that conveys female insecurity @Ethan uses to denote sexism in science is his favorite, the climate trend is another one he likes and he included it both in the original piece and the 1st follow up.
http://scienceblogs.com/startswithabang/files/2016/03/Escalator_2012_10…
Judging the effect of a short term variation like an El Nino on top of other short term variation from the weather in general by comparing it to a long term linear trend is a pretty silly thing to do. You can't seriously expect to get a good estimate from that, let alone better than what experts have determined by actually measuring it.
If you want to do an estimate by eye balling a graph then at least go by something like a trend line that's a running mean.
http://data.giss.nasa.gov/gistemp/graphs_v3/Fig.A2.gif
That gives around 0.2 for the 1998 El Nino on top of the trend line.
@surething #14
A 5-year running average is too noisy to tell you anything. See post #12.
You're confusing two things again.
5 years would be too short to accurately tell you the trend in degrees C/decade, (because of things like El Ninos) which is what the paper is talking about. It has no relevance as far as comparing one year to the one before and after it.
What is noisy is looking at monthly values like the ones in the escalator graph. Comparing those to a less noisy line like a 5 year running mean is far more honest than looking at a linear trend over 45 years.
If you still want to play that game we can look at an even more accurate trend line though, that of the entire record since 1880. If we do that then it's not just El Nino years that are above the trend line, every year including the 10 or so La Nina years since 1998 are above it.
How much use is that in determining the effects of those La Ninas?
@surething #16
To properly judge the scale of a weather anomaly, you subtract out the climate baseline and whatever is left is the anomaly. As per the provided peer reviewed work, you need a minimum of 17 years to discern the climate signal.
Secondly, ENSO reversals are multi-year weather phenomena that are an active area of research. It starts with a breakdown of prevailing pressure systems that cause the trade winds to collapse, which in turn causes the warm water usually pooled off Indonesia to leak out Eastward in the Pacific. The year before and after the Eastern Pacific water temperature peak are part of the package. Even 3-year periods are too small to fully contain some ENSO events.
As a side note, I'm on solid ground on this one. Much more solid than usual, and your shopping any graph you can distort along with dismissal of widely accepted climate science all in the effort to deny that someone like me just might have a point is amusing. By all means carry on.
Funny, the level of confusion only increases as time goes on, but at the same time the level of confidence increases even more.
Trend lines and base periods aren't the same thing.
If you get the scale of an anomaly from subtracting out the baseline then why did you subtract out the trend line instead?
If ENSO effects are multi-year phenomena why are you looking at monthly data to determine the scale of an El Nino instead of looking at its average effect?
If Ethan talks about the effects of El Nino on the average temperature of a year why are you looking at monthly data instead of that year's average?
Also, "shopping any graph"? It's probably the most commonly used and respected graph/data around. In fact it's the same source the escalator graph is made from, just yearly averages.
Claiming to be on solid ground when no climate scientist agrees with you and without actually providing any relevant data either is amusing though.
@surething #18
All sources other than Santer's published work were provided by @Ethan in the argument I was commenting on. You'll have to ask him why he chose the data he did.
I see you ignored the first question, not as easy to blame someone else for that one I suppose.
Ethan didn't get his estimate from that graph, something you know full well.
Even if he wanted to do that he couldn't as that graph only goes up to 2012 and he is commenting on 2015...
You were that one that used that graph in relation to El Nino, no one else did.
You can't expect to hide behind sources that were only in the original articles and then at the same time go beyond those articles to explain how El Ninos work and how they are multi-year phenomenon while deliberately ignoring data that would account for that.
Either you're playing dishonest games or you lack far too much knowledge to make claims relating to this subject.
Actually, just going by your last comment it looks like both are at play here.
@surething #20
Bantering with you is like talking to the guy from Memento.
1 - @Ethan declared some facts about 2015/16.
2 - I expressed doubt about about his claims being actual fact.
3 - You wanted to know the source of my skepticism.
4 - I pointed out the history of events provided in @Ethan's own material that I felt made the claims about 2015/16 dubious.
5 - You began spinning furiously.
5 - I provided you with reasons why 4 had no relation with doing proper science.
6 - You continue to fail to acknowledge any of it.
7 - You continue to demonstrate you don't know what you're talking about including things that were already explained to you in 5.
8 - You continue to be entirely unaware of this.
I'm glad you're admitting to "bantering" or trying to troll. I don't think it's working as well as you're imagining it to be though.
Here's a tip, you aren't supposed to tell the audience the other person is looking bad, it should be obvious to them. When you try to force it that way the roles have already reversed.
Can you say "Venice"?
The maximum documented tide level is 194 cm in NOVEMBER "1966"
https://en.wikipedia.org/wiki/Acqua_alta#Exceptional_high_waters_since_…
HELLO McFLY Anybody home...
"The maximum documented tide level is 194 cm"
And I call CHERRY PICK!
Not to mention irrelevant.
"" I call CHERRY PICK! And it’s another echo chamber proof of denierdom."
That is because you don’t know what you are talking about."
That's what you say, but it's a complete lie.
"The 17 year minimum used by both sides was from"
A lie.
“Separating signal and noise in atmospheric temperature changes: The importance of timescale” by Benjamin Santer et al.
Which you never read, because it doesn't say what you claim.
Depending on what you are looking at, the signal exceeds the noise FOR SOME OF THE DATA over the PERIOD SELECTED, with 17 years' worth of data.
WMO have defined 30 years as climate.
17 years, meanwhile is the asinine and toxic "begged question" put to Phil Jones on the data from 1996. And denierdom have stuck to "no warming signal for 17 years" and even tripled down on it by adding more to that lie ever since. Even though that#s absolutely false.
But denial requires denial of lots of bits of reality, doesn't it.
"…and how often do you see me citing WUWT?"
Lots of times. *linking*? Not so much. But you do cite whatever "new information" Tony "Dumbass" Watts plops out of his nethers for you to woship as gold dust.
That moron Goddard is frequently cited by you and is a major contributor to the bullshit his site promotes.
"Either you’re playing dishonest games "
Oh, it's both.
Too dumb to know, too careless of the truth to worry.
"A 5-year running average is too noisy to tell you anything. See post #12."
A 5 year smoothing removes over half the noise from a trend. (1/sqrt(5) to be more precise).
Seems like you don't know what you're talking about.
"To properly judge the scale of a weather anomaly, you subtract out the climate baseline and whatever is left is the anomaly"
And you find that El Nino's aren't changing the climate. AGW is.
"you need a minimum of 17 years to discern the climate signal."
Only if you don't read the report, or have it spoonfed what you want it to mean by a liar like Watts.
17 years doesn't give the climate. It doesn't even give the trend. It's around where the current trend is as big as the trend-free noise around the climate.
If the climate were not changing, then that required time would be infinite. That it's changing enough in 17 years, at some point, indicates how rapidly the climate is changing.
But this still has nothing to do with El Nino. The PDO and AMO aren't climate changes.
"As a side note, I’m on solid ground on this one. Much more solid than usual"
No, you're as clueless as always, you haven't understood a damn thing about it.
You just have more cluelessness that you think you don't have than normal.
"1 – @Ethan declared some facts about 2015/16."
Why point this out? The only one disagreeing is you and teabagger.
"2 – I expressed doubt about about his claims being actual fact."
And a flat earther expresses doubt about NASA's moon landings. Doubt does not make for a valid point.
3 – You wanted to know the source of my skepticism.
Nope, he asked whether you changed your tune now you agreed that Ethan gave out some facts (which you agreed in #1 happened).
You then started spinning.
4 – I pointed out the history of events provided in @Ethan’s own material that I felt made the claims about 2015/16 dubious.
Except that claim is a lie.
5 – You began spinning furiously.
As is that one.