
 h/t to JM for More on the Iconography of IPCC 1990 Figure 7 - scroll down for the breathless prose.
First the background: why does anyone care about figure 7.1.c of the IPCC '90 report? Well, if you're a denialist you care, because it represents the true uncorrupted state of climate science before the evil taint of the hockey stick crept in. I suppose if anyone doesn't believe that and challenges me I'll have to go crawling in the slime for references, so please don't make me do it. So, the septic storyline is "true uncorrupted state" -> "corrupt hockey stick". That works OK with a naive audience; it doesn't work very well if you put the correct dates in because if you write "true uncorrupted state (1990)" -> "corrupt hockey stick (2001)" even naive people will start to say "hold on there's a bit of a gap in the middle there, no?" And indeed there is; the gap is filled, in IPCC world, by the 1992 supplementary report and the 1995 second report. Neither of which feature fig 7.1.c or anything like it. So (just to spell this out to make it really obvious) figure 7.1.c had already disappeared from the IPCC narrative well before the hockey stick ever came into being; the hockey stick did not displace it because it was already gone; the hockey stick was not created to displace it because it was already gone. So the entire denialist narrative falls apart, again. Read more about it at the snappily titled Description of the Medieval Warm Period and Little Ice Age in IPCC reports.
Anyway, errm, where was I? Oh yes, The Significance of the Hockey Stick at CA. This post has now been corrected, ungraciously, after I pointed out it was wrong. But now it has been corrected, it makes no sense, because of the unseen presence of the '92 and '95 reports, which CA is obliged to ignore. And then we go back to the weird stuff in the last CA post, which seems to be McI scrabbling for credit. He has a very thin publication record but I didn't think he was that desperate.
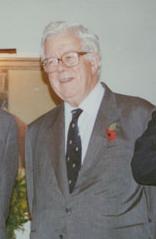
Outside of a few fellow brits of a certain age and inclination, the Geoffrey Howe picture is going to seem a little out of place. Apropos though. ;-)
[Not as subtle as I thought I was, but I bet some rotter gives it away :-) -W]
http://www.telegraph.co.uk/news/politics/margaret-thatcher/8127533/The-…
actually this is a better link to the original phrase
http://news.bbc.co.uk/democracylive/hi/historic_moments/newsid_8185000/…
What's he got? Nothing. He is reduced to going over the same old topics now, which have been done to death already. It's either that, or harassing people with FOI requests that have nothing to do with the science.
Here is another piece of ancient history he got wrong as well.
http://climateaudit.org/2005/04/23/moberg-satellite/ They were the good old days, when the UAH told everyone there was no warming.
"but I bet some rotter gives it away"
:-)
[There's always one -W]
Ah but, but, following a 2008 blog by McI which said the cartoon came from Lamb 1965, in a leaked email Gavin Schmidt wrote "McIntyre has worked out where IPCC 1990 fig 7.2 has came from (almost). We are being scooped!" An amazing breakthrough for McI, only a year after you'd pointed out at http://en.wikipedia.org/w/index.php?title=Description_of_the_Medieval_W… "it resembles figure A9(d) from the 1975 NAS report, which is sourced to Lamb, 1966". The NAS report seems to be “Understanding Climatic Change: A Program for Action” which you reviewed in 2001. It doesn't seem to be available online, does their graph have three panels matching fig 7.2?
[I have NAS at home - previously it was there because of the "global cooling" nonsense. I have a feeling that I've previously checked for fig 7.1.c stuff, but I'll look again later -W]
[I looked; the answer is http://www.flickr.com/photos/belette/8048538078/in/photostream. No, there aren't 3 panels there are 4 and the layout is very different -W]
McI discusses Tickell as a possible source, and corrects himself in the first instance that it was '86 and not '77, but forgets to correct himself later when it would make his ramblings look sillier. He's excited about the "ur-graphic" which Tickell attributes to the British Antarctic Survey – do you have access to the presumed BAS graph?
[I'm not sure what he's going on about there. I don't have access to such a graph, and I don't believe one could have originated in BAS -W]
Agreed, but where is the contemporary evidence that Singer, Seitz and their friends were being so kind to the hockey-stick-free-1990 report?
[Oh, I don't think they liked it *then*. It was only after the HS came in that '90 became perfection -W]
Thanks, look forward to info about the 1975 NAS report, and whether it has graphs similar to fig 7.1 a + b as well as c.
On Tickell '86, the precise wording is "Figure 2: Temperature variations over the last million years. Courtesy of the British Antarctic Survey." http://www.crispintickell.com/page80.html
Regarding pre-hockey stick MWP sentiment, the earliest I've noticed is the George C. Marshall Institute in June 1998 having a go at MBH98 for not going as far back as the MWP!! They claim that "the climate was considerably warmer than now" and rousingly conclude that "The Medieval Warm Period must have had a natural origin. The 1990 report by the UN Intergovernmental Panel on Climate Change notes, 'there is no evidence that [the Medieval warm period] was accompanied by an increase in greenhouse gases.'" So even then deniers liked that part of the FAR.
Note that it is well worth reading the few pages of text that surround the graph in IPCC(1990). A few caveats appear, but it runs out many people who've promoted the graph either didn't read that or else cherry-picked what they liked.
Note that it is well worth reading the few pages of text that surround the graph in IPCC(1990). A few caveats appear, but it runs out many people who've promoted the graph either didn't read that or else cherry-picked what they liked.
That's here Chapter 7 (~p.202).
That last link is busted...
[Thanks. Fixed. I just do it to check that someone reads this stuff, of course -W]
Your Geoffrey Howe iconography is all wrong. You've actually been savaged by a dead Lamb.
[I could have used a pic of Howe as a baby to be really subtle -W]
I just assumed it was Lamb at first, and even with Gavin's hint had to look it up since I recalled the quote but not its context (although I think "savaged" would have cued it for me).
Elsewhere, I notice that the last few days have been big for hockey stick papers. Poor McI, everything he ever does will be seen in light of that meme.
As per < the thing that stirred this up, see Falsification, flat-earth maps, dog astrology journal.
There are more shoes (or hooves) to drop in the IPCC 7.1c story, as well as the dog astrology journal part. The latter induced A.Scott into a determined defense of the relevant canine-related journal. Meanwhile, Willard finds some useful info.
I'll leave readers to judge for themselves who is the intellectual heavyweight in this interwebby sprat. ;-)
More background here.
see P Lewis link (above) for "Abraham vs. Monckton in 15secs"
or is it Hadfield on the left? could be any number of people really
I was thinking more in line with the subjects in this thread... but you are of course correct :-)
What's McI on about? Going way back to the 1990 IPCC report and trying to justify / rehash something he wrote 2005? McI is demonstrating worse symptoms of the guano type every day.
A right nutter!
Thanks for making the 1975 NAS graphs available, as you say they look too different to be a likely source of fig. 7.1.
That brings us back to McI's claim that his 2008 CA post showing his smoothing of Lamb '65 had brought to light Tickell's 1986 Figure 2 "Courtesy of the British Antarctic Survey". He pores through the CRU emails to claim that they'd been alarmed by him getting this result first, and is dismissive of the Jones et al. 2009 paper's view that Lamb 1982 is the source. McI then whines, as usual, about not getting credit for his "discovery".
Fortunately, Lamb 1982: Climate: history and the modern world. Methuen shows up in the google books, and the ur-graph appears nicely on page 76 if you search in the book for "probable fifty-year averages".
As to why McI does this, the narrative about universal agreement with Fig 7.1 (c) until the nasty MBH98 is central to arguments such as "The Hockey Stick Illusion" by Montford (Bishop Hill, a Pap of Lomond).
Rather undermined by caveats in the 1990 FAR itself and the increased doubt about the MWP in the 1996 SAR. The MWP was still being used by contrarians when Kyoto came under discussion, for example November 3, 1997, in the Parliament of Canada where Dr. Gordon McBean puts the mainstream view, and Dr. Roger Pocklington (associated with the Fraser Institute) argues that wheat was grown in southern Greenland during the MWP.
http://www.parl.gc.ca/HousePublications/Publication.aspx?DocId=1038119&…
And another reason... Mr. McIntyre, a self-declared expert in statistics, has been taken to the cleaners by Stephan Lewandowsky, Winthrop Professor, School of Psychology, University of Western Australia.
After a flurry of denial and paranoid conspiracy theorising, Mr. McIntyre suddenly became a self-declared expert in the use of statistics in psychology, and has been blogging away about "Lewandowsky’s fake data and false results". Stung by John Massey's aside in Lewandowsky’s blog comments, a sudden diversion – oh look, a squirrel!
Well, indeed he may not have liked False citation, flat-earth maps and sourcing from dog astrology journal, but some of his fans liked it even less. Until his departure, "A.Scott" mounted a spirited defense of the dog astrology journal, a source on which Richard Lindzen, Andrew Montford, and many others have relied to provide Truth.
The interesting question is whether or not McIntyre had read the relevant part of IPCC(1990) and had a copy when writing 03/16/05 post.
The 1995 confusion raises doubts and there may be other issues.
Certainly, by )6/25/05, he msut have had IPCC(1990).