Global Warming
According to some estimates, if sea levels rose one meter, Boston would lose 3% of it’s land surface, Washington DC a mere 1%. Tampa and Miami would lose 18% and 15% respectively. New Orleans would lose 91%.
A six meter rise would result in much larger losses. Norfolk, Virginia and Miami Florida would be essentially gone.
These estimates use the assumption that the sea level rises in those areas vertically, and the corresponding topographical level in the coastal city becomes the shoreline. They don’t account for the fact that the ocean does not work that way. (see Sea Level Rise…Extreme…
Media Matters takes Fox News to Task. Watch the reasonable person talk, then watch the Republican climate science denialist lie:
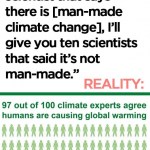
Here is a graph from Media Matters that you should post on your Facebook page and elsewhere:
From Media Matters: "The American Geophysical Union and several other scientific bodies including the National Academy of Sciences have acknowledged manmade climate change based on a strong and growing body of evidence.Despite all of this, Fox News has continually and falsely claimed the consensus on climate change does not exist -- yet another example of the network's…
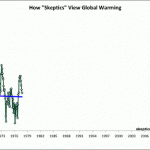
Skeptical Science is a great source for information about climate change. One of the coolest things they've got over there is a moving GIF demonstrating how the folks in the climate science denialism industry try to convince people that global warming isn't real. This involves cherry picking data to show small segments of time with either flat lines (no warming) or decreasing lines (cooling), and ignoring that the longer term pattern is one of a distinct increase.
Here's the graphic:
How to make it look like global warming is a hoax!
For more information about this graphic, and other…
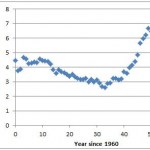
I'm not sure about the NUMBER of fires. That might be hard to count. If five small fires emerge and are put out, there are five fires. If five fires emerge, join into one configuration, and wipe out a handful of mountain villages in the Rockies, that's one fire. It might be better to look at acreage burned per year.
My friend John Abraham has used the data supplied by National Interagency Fire Center to make a graph of acreage burned per year since 1960. The graph is a 10-year running mean of millions of acres burned in the US.
Here is the graph:
The annual rate of acreage burned in…
Published on Jan 25, 2013
Session 6: Dr. Jennifer Francis - Rutgers University
Topic: Wacky Weather and Disappearing Arctic Sea Ice: Are They Connected?
Michael Mann is one of the key climate scientists of the day. History will crown Mann as one of the great heroes who defended the freedom to do science rationally despite constant attacks from mean spirited and ignorant, self interested, politically motivated, oil-money-soaked climate science denialists. You know of Michael Mann as the coiner of the term "hockey stick" to refer to the alarming uptick in temperature and related measures connected to the human caused release of copious quantities of fossil Carbon into the Earth's atmosphere, causing one of the greatest disasters this planet…
NOAA says 2012 was the hottest year on record.
According to the National Climatic Data Center of NOAA, 2012 was the hottest year on record in the US lower 48:
According to NOAA scientists, the average temperature for the contiguous U.S. for 2012 was 55.3°F, which was 3.2°F above the 20th century average and 1.0°F above the previous record from 1998. The year consisted of the fourth warmest winter, a record warm spring, the second warmest summer, and a warmer-than-average autumn. Although the last four months of 2012 did not bring the same unusual warmth as the first 8 months of the year, the…
Some may deny the science of climate change, but we're not listening to them any more.
Hat tip to Peter Sinclair for this clip:
I was a graduate student in Harvard’s Anthropology Department, which meant I had no funding. I was in the final writing stage of my thesis, and the problem I had was that teaching interesting biological anthropology (which I could do full time if I wanted) was too distracting from the mundane yet mentally challenging task of writing a PhD thesis. So, I got a job as a secretary at the John F. Kennedy School of Government. Since I was able to follow instructions and was also not intimidated by Big Scary Professors as most temps were, I quickly rose through the ranks and became Richard…
A Draft National Climate Assessment has been released by the “National Climate Assessment and Development Advisory Committee.” You can download it here … warning: it is a PDF file way over 100 megabytes
The report affirms that climate is changing and that this change is primarily caused by human activities, mostly the release of fossil carbon into the atmosphere by burning fuels. The report notes an increase in weather extremes and that these extremes are being recognized by the relevant climate science as linked to these human-induced changes.
Details about the committee, the report, and…
The UK Met Office, a climate agency, released some information about the immediate future, based on modeling. Briefly, it notes that natural cooling effect may temporarily ameliorate the increase in temperatures caused by global warming in some locals; it does not say that global warming is attenuated in any way whatsoever. It is more of a long term weather forecast than a climate change prediction.
The climate science denialist community, a community run by willfully wrong miscreants and with a following of mostly ignorant sycophants, and which only likes modeling when it seems to show…
Looking just at the contiguous 48 states of the US, NOAA has determined that 2012 was the warmest year on record. It was also ranked second in "extreme" weather events including fires, major storms, and drought. Tornado activity was less than average.
The report came out yesterday and states:
In 2012, the contiguous United States (CONUS) average annual temperature of 55.3°F was 3.3°F above the 20th century average, and was the warmest year in the 1895-2012 period of record for the nation. The 2012 annual temperature was 1.0°F warmer than the previous record warm year of 1998. Since 1895,…
First, a word about the Australian Bureau of Meteorology's position on climate change, heat, and fires. It has been suggested (by a commenter here) that the BoM is claiming that the current heat wave is not related to climate change, but rather, a matter of natural variability and a late arriving monsoon. But that is not true. The BoM has a different take on the current situation. From Ben Cubby, an Australian journalist:
The heatwave that has scorched the nation since Christmas is a taste of things to come, with this week’s records set to tumble again and again in the coming years, climate…
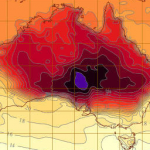
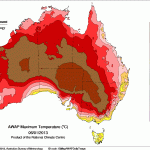
Australia is experiencing a heat spell. The Climate Information Services of the Australian Bureau of Meteorology has issued a special statement (I'll provide some details below). This is not unexpected, since over the last few years global warming due to the human release of large amounts of fossil Carbon into the atmosphere has been heating everything up. In fact, a paper that came out mid (southern) winter 2008 predicted that by the end of the century, extreme high temperatures in Australia would reach 50 degrees or more. I'll provide some data for that too. But first, since most of…
Summer is coming on strong south of the Equator, and in Australia this has meant unprecedented record high temperatures, and in the state of Tasmania, severe brush fires that have destroyed numerous homes, adding to the bad news from fires in the southeastern mainland. Prime Minister Julia Gillard said "And while you would not put any one event down to climate change ... we do know that over time as a result of climate change we are going to see more extreme weather events." That is not exactly true, of course. There are no climate related events that lack the fingerprint of global climate…
Top “Ten” Recent Books (focusing on 2012 but including the last few years) on Climate, Science denialism, Energy, and Science Policy are (including one Post Warming novel) are:
Before the Lights Go Out: Conquering the Energy Crisis Before It Conquers Us by Maggie Koerth-Baker
Climate Change Denial: Heads in the Sand by Haydn Washington and John Cook
Deep Water: As Polar Ice Melts, Scientists Debate How High Our Oceans Will Rise (Kindle Single) by Daniel Grossman, TEDx Books (Kindle Single)
Fool Me Twice: Fighting the Assault on Science in America by Shawn Lawrence Otto
Rising Sea Levels: An…
A group of us, all interested in climate science, put together a list of the most notable, often, most worrying, climate-related stories of the year, along with a few links that will allow you to explore the stories in more detail. We did not try to make this a “top ten” list, because it is rather silly to fit the news, or the science, or the stuff the Earth does in a given year into an arbitrary number of events. (What if we had 12 fingers, and “10” was equal to 6+6? Then there would always be 12 things, not 10, on everyone’s list. Makes no sense.) We ended up with 18 items, but note that…
But not as severely as they should have been.
The IPCC, as you know, comes out with a set of reports every five years. The reports are written by groups of experts. Draft reports are widely accessible to people who register themselves as "experts" and there is no quality control in that process, in order to keep things as transparent as possible. This means that the worst climate change denialists can simply sign up as "experts" and flood the scientists trying to write these reports with irrelevant and stupid comments, thus, I presume, wasting valuable time and effort. But, such is the cost…
There are these things called "Atmospheric rivers." They are big long things up in the air that are loaded with water vapor, and much of the rain and other precipitation we experience comes out of them. This is notable when one of these rivers is extra wet, and there is an extra wet one out West in the US.
The Sierra Nevada range will be accumulating something like 16-20 inches of rain, but where that translates into snow, it will be up there in the 12 foot range, maybe more. There will be a very significant risk of flash flooding north of Sacremento and places in northern California and…

