This graphic is from GRID-Arendal, a Norwegian Foundation collaborating with the UN Environment Programme. It shows CO2 concentrations in the ocean going up over a period of 20 eyars, and the corresponding drop in pH over the same time period.
Ocean acidification is a serious effect of climate change.
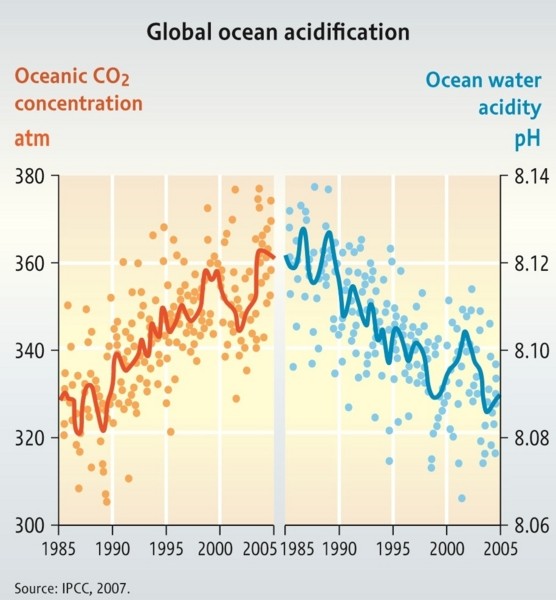
There are more climate change related graphics HERE.
- Log in to post comments
More like this
Focusing on Earth, but also a few tidbits on wind, fire, and ice, some current news and observations about global warming.
Earth
As humans release greenhouse gas pollutants (mainly CO2) into the atmosphere, the surface of the Earth, and the top 2000 meters of the ocean, heat up. But some of the…
Each of these graphs from the IPCC policy summary shows the global surface temperature relative to a 1961-1990 arbitrary baseline. The upper graph shows the annual average, and thus captures a sense of variation reflecting a wide range of causes, but with a general trend from the early 20th…
Following on the heels of Malaria, Bedbugs, Sea Lice and Sunsets and Southern Fried Science, I am posting this fantastic letter about ocean acidification by Randy Repass and Sally-Christine Rogers of West Marine (originally posted at The Intersection). Ocean acidification is, for me, the real crux…
**A post about Climate Change as a part of Blog Action Day 2009**When people talk about climate change, they, more often than not, talk about global warming. Yes, the effects of increased temperature will be diverse and generally bad for most creatures on Earth, including us. But the most dramatic…
Correction: "Ocean acidification AND CLIMATE CHANGE ARE a serious effect of EXCESS CO2"
That may indeed be a better way to put it, thanks for the suggestion.