
I’m sure the measurements are still being checked and adjusted but it is clear that Typhoon Haiyan/Yolanda was one of the most powerful tropical cyclones (termed “Typhoon” in the western Pacific) ever recorded. There are several ways to measure how big and bad a tropical cyclone is including it’s overall size from end to end, how low the barometric pressure gets, how high the sustained wind speed is, and how wide that wind field is. In addition, when a typhoon hits land details matter. The front right quadrant of a counter-clockwise spinning typhoon packs the maximum punch and if that part of the storm enters an embayment during high tide the storm surge can be immense. It seems that the storm surge for Haiyan/Yolanda was in the many tens of feet range, and quite possibly will be found responsible for the largest part of the still uncalculated death toll.
But here I want to look at one single factor that almost certainly contributed to the growth of Haiyan/Yolanda into a very powerful storm, a factor that probably doesn’t usually play into a storm’s strength. I refer to an anomaly in sea surface temperatures that was almost certainly caused by global warming, as part of a general warming of the ocean. But first a bit of background on the link between sea surface temperature and hurricanes. This is one of several factors that may be involved in climate change related effects on tropical storm intensity, a situation with which we should be concerned.
Tropical cyclones run on heat, and much of that heat comes from the sea surface. If the surface of the ocean is below a certain temperature, about 82 degrees F, about 28 degrees C, a hurricane or typhoon is very unlikely to form. Above that temperature, if other conditions are right, it may form. Warmer seas can make bigger or stronger storms, and as the storm passes over the ocean, the temperature of the sea surface has a strong influence on whether the storm increases or decreases in strength . As the storm moves over the sea, the interface between the windy storm and the roiling ocean becomes something of a mess, as though the surface of the ocean was in a blender, and there is a lot of exchange of heat across that interface. Also, deeper, cooler water is mixed with warmer surface water. A powerful storm moving across the ocean will leave in its wake a strip of cooler water. This sometimes causes subsequent storms moving along the same path to be weaker or to downgrade in strength more quickly.
This should indicate, one would think, that as sea surface temperatures (SST) have gone up with global warming, there should be more “hurricane” out there on the oceans. It has been hard to make the link between global warming and frequency of hurricanes, however. This may be because of the nature of hurricane formation. Once a hurricane forms in a given spot and gets big, it may reduce the chance of the next hurricane forming. Also, hurricanes are usually born as waves in a very large scale pattern of air masses. The total number of waves that form may not change with global warming, and the hurricane season is only a part of the year, and other factors have to come into play that are also ponderous in their timing to turn a wave into a major storm. An analogy might be this: Imagine that everyone in the working population of a downtown neighborhood becomes hungrier, perhaps because all the companies they work for insist on a two hour high intensity exercise program for everyone to lower their health insurance costs. Will this increase in hunger mean more lunches, snacks, and dinners consumed in the local restaurants? Or will the lunches, snacks, and dinners become larger, with people ordering more food with each sitting? Since there are only so many opportunities to go grab a bite to eat, there will probably be very few additional visits to the local eateries, but more food may well be consumed per event. Increased SST may be like increased hunger. There may not be very many more hurricanes, but among those that occur, some may be much stronger.
There is evidence for this. Kerry Emanuel did a study several years ago that linked sea surface temperatures in the Pacific with an index called PDI, which measures the overall energy involved in typhoon/hurricane activity. (Emanuel, K. (2005). Increasing destructiveness of tropical cyclones over the past 30 years, 436(August), 686–688. doi:10.1038/nature03906.) He came up with this graph:
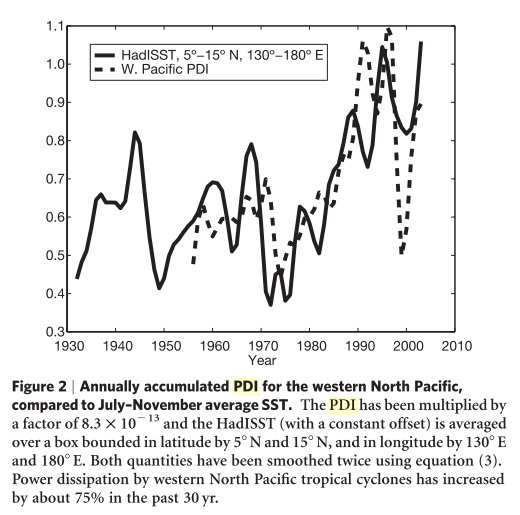
The graph shows that hurricanosity, as it were, goes up and down with sea surface temperature more or less. And, SST goes up and down with decadal oscillations like ENSO (El Nino) but with an overall upward trend caused by global warming.
Here’s the new part. If you look at a map of Sea Surface Temperature you are seeing a measurement of, well, the surface of the sea … the top of the water. As a hurricane chugs along on the surface of the sea, turning the top meter or so of ocean into spray and creating a very wavy situation, that heat is certainly directly affecting the storm, but the temperature of the water several meters down also matters. It turns out that sometimes this shallow-deep water (as opposed to deep deep water, way down farther) can be quite warm. When that happens, the dissipation of SST does not occur to the same degree. The leading edge of the hurricane gets a good dose of heat from the surface, but instead of the SST dropping as the top warm water is mixed with somewhat deeper cooler water, the heat supply is not attenuated, or at least not by much, as the massive storm moves along. More of the storm gets more heat, and the storm as a whole gets more heat. And there’s more heat left over for the next storm.
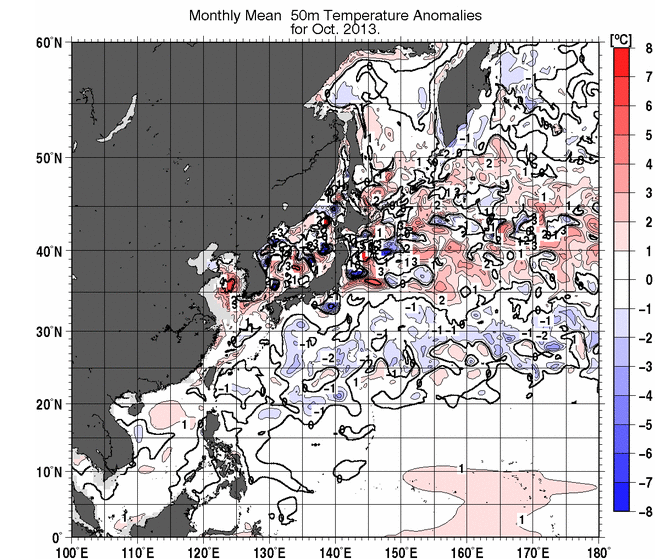
We think this happened with Haiyan. Have a look at the following map. It is sea surface temperature anomaly (how much more or less than expected the SST is) for the top 50 meters for the western Pacific at the time of the typhoon. The Philippines is down near the bottom of the map straddling the 10 and 15 degree N lines. (Maps are from here) Notice that the surface is not unusually warm.
This does not mean that the sea surface was not warm. It was plenty warm as it is this time of year i that part of the ocean, just not warmer than expected. Here is the raw temperature (not anomaly) map so you can see that the tropical ocean is, well, tropically warm:
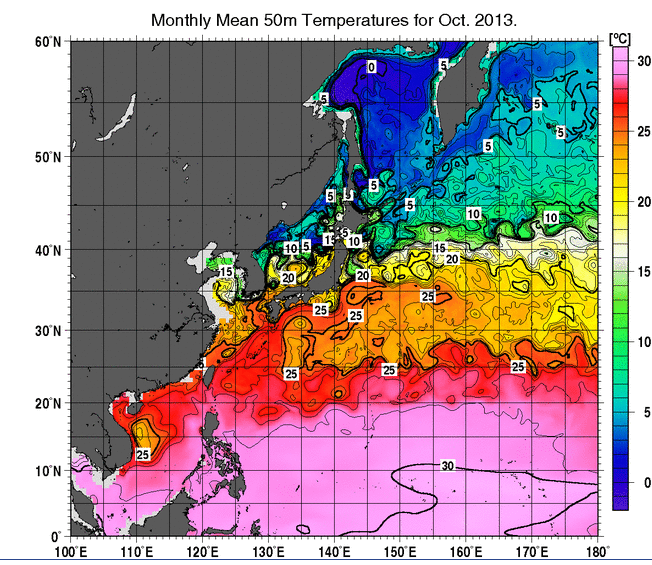
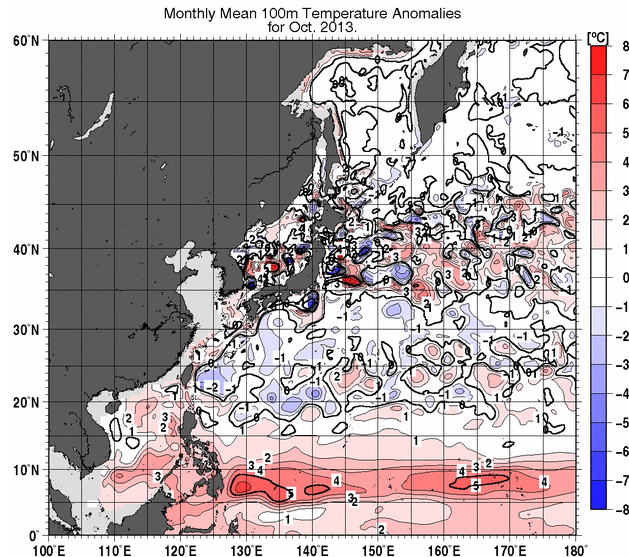
The purple area along the south is sufficiently warm to form typhoons. The ocean to the east of the Philippines is warm enough to form typhoons, but is there any source of extra heat to form a super typhoon? Have a look at this map. This is the water temperature at depth, here at 100 meters. This is an anomaly map, so its shows if the temperature is more (or less) than expected. Notice that east-west band of red indicating several degrees warmer than it usually is, at depth.
[Updated:] Here’s the same map with Haiyan/Yolanda's track and history, graphic generated by Jeff Masters.
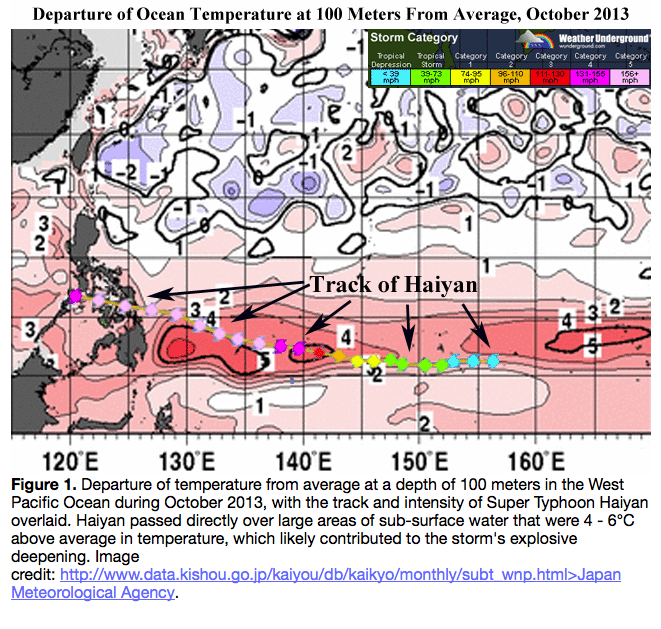
So, it would appear that Haiyan/Yolanda passed over the usual very warm waters that allow the formation of typhoons, but also, over water that was warm at depth so as the top of the sea is churned up by the growing storm, there would be extra heat to feed that storm.
One final map. This is the actual temperature (not anomaly) at the 100 meter level. Notice the purple area.
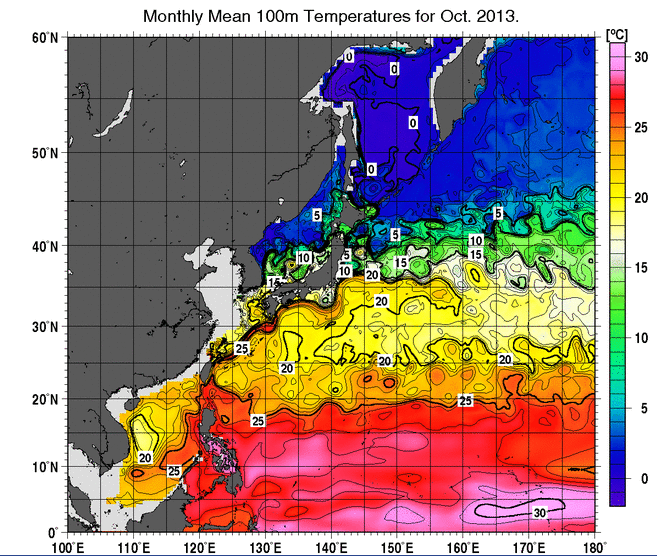
At 100 meters depth, the sea was warm enough to form a typhoon. That, dear reader, is extreme.
The same thing happened with Katrina. According to a report from NOAA:
A number of factors contributed to making Katrina a strong Category 5 hurricane…Sea surface temperatures (SST) in the Gulf of Mexico were one to two degrees Celsius above normal …, and the warm temperatures extended to a considerable depth through the upper ocean layer. Also, Katrina
crossed the “loop current” (belt of even warmer water), during which time explosive
intensification occurred. The temperature of the ocean surface is a critical element in the
formation and strength of hurricanes.
We know that the ocean is absorbing a lot of the extra heat caused by global warming. Well, this is some of that heat, causing megastorms.
I’ve noticed that climate science denialists are very adamant about two things: Denying the importance of major storms like Haiyan, and denying the fact that heat is going into the oceans. Perhaps they see the link, and are frightened that people will believe that anthropogenic changes to our climate can kill thousands of people at a time, in a few hours, through the mechanism of anomalously high temperature at modest depth below the surface of the already tepid tropical sea.
It is time for action.
I'm a little confused about the northern part of the maps. Looking at the first map, it appears that the area around the Aleutians is warmer than usual and the currents hitting the Philippines is warmer than usual. These currents flow west towards Asia. When the hit Asia, they are diverted towards each other and, off of southern Japan combine and flow east to the Pacific Northwest of The US and Canada. This is the current that has been bringing us debris from the 2011 earthquake and tsunami. Why is the combination of two warmer than usual currents creating a cooler than usual current. Am I misreading the map, or is there some deepwater mixture happening off Japan?
Blue is cooler than expected. Are you looking at the blue anomalies? Two cools may be as unlikely to make a neutral as two warms are, but since this is an anomaly map it may appear to be anomalous
I'm not sure exactly what is happening there in this map at this time, but the northern contributor to the Northern Pacific Current (the top of the Pacific Gyre) is the cool Oyashio current. Which way the anomaly goes with the return current would be a function of how warm/cool the two different (and different sized) warm/cool currents are. Also, though these are surface currents I'll bet there is a contribution from upwelling along the coast.
Maybe you should have explained what all the abbreviations mean before using them.
I explained SST and PDI, what did I miss?
There a three diagrams -- all with the same title and all different. Also some part (upper left part) is of a color which is not shown in the legend.
I'm very curious about the difference between temperature and temperature anomaly.
figured out that the left upper part is korea& china.
All the good stuff is explained in the text.
An anomaly is the difference between the climatic average and the present. So if on June 1st a certain part of the ocean is on average 75 degrees F but it is now 77 degrees F the anomaly is +2.
The average is calculated along some decade long baseline. Unfortunately we sometimes fight over what the baseline should be but it is always in the past at least.
Or maybe heat is coming up from the deep ocean, which is why Katrina was at the tail end of an active three years in the much shallower Atlantic/Caribbean followed by no hurricanes making landfall since. In fact, since there was very little anomaly at the 50m depth, it would seem likely that the energy is coming from the other direction. Especially if the baseline is more than 15 years, the "new baseline" of higher but consistent with each other temperatures.
You quote from a NOAA report that Katrina's strength was attributable to high sea surface temperatures, warm temperatures at depth and the hurricane's passing over the "loop current." And you imply that this unusually warm gulf water was a result of global warming and therefore Katrina's strength was related to or caused by global warming. Do I have this right?
If that is right, how is it that Hurricane Camille became a category five hurricane in almost the same manner in 1969 -- before there was any global warming. Or maybe there was some ... I don't know.
More confusing to me is the number of serious hurricanes (Opal in 1995, Allen in 1980 and for example) that have gained strength from the Loop Current but we haven't seen much since 2005. What has changed since then? Can there be too much heat? Is the Loop Current cooler?
The information I have about the Loop Current and hurricanes comes from Wikipedia.
http://en.wikipedia.org/wiki/Loop_Current
The loop current is a different issue. In the absence of measurements we can't say anything about deeper warm water for earlier TCs. Of course there was warming in the 60s!
I finally found something useful about the typhoon
Tell more about the typhoon itself
"is this a trend?"
Nope. Page 5 of the following paper has some good graphs showing the complete absence of a trend in any area of the globe:
http://models.weatherbell.com/weinkle_maue_pielke.pdf
However, I'm sure Greg will say that climate models' predictions of increasing storminess is 'evidence' of a trend. Remember Greg, models aren't empirical evidence, just someone's idea about what they believe is a coming thermageddon.
"is this a trend?"
Nope. Page 5 of the following paper has some good graphs of empirical measurements showing the complete absence of a trend in any area of the globe (don't ask me why the link has the word 'models' in it - the graphs are compiled from hard data, not silly models)
http://models.weatherbell.com/weinkle_maue_pielke.pdf
However, I'm sure Greg will say that climate models' predictions of increasing storminess is 'evidence' of a trend. Remember Greg, models aren't empirical evidence, just someone's idea about what they believe is a coming thermageddon.
"It turns out that sometimes this shallow-deep water (as opposed to deep deep water, way down farther) can be quite warm."
But, but, but.....
...we were all told that the heat in the Pacific had gone to hide in the DEEP oceans.
For instance, according to some model cobbled together by Trenberth the surface waters of the Pacific were supposed to COOL and all the heat was going to dive down and hide in the ocean depths:
http://www.sciencedaily.com/releases/2011/09/110918144941.htm
So Greg, when are you going to tell Trenberth that he's got it all wrong?
Whoops sorry about my multile posts saying the same thing - internet at my end playing up.
Please feel free to delete to of the three (and this as well)
Andy, you are mistaken to think that the heat can only go to one part of the oceans Yes, there is considerable heat going into the deep oceans . What you've done here, I think, is see the word "cool" and misapplied it.
The Weinkle et al paper graph you refer to is about frequency, the Emanuel paper is about total energy/strength of tropical cyclones, and the latter is what I was referring to in this post .
Funny, though, how you use one "model" that you misinterpret to support your case but also denigrate models. You keep using that word "model" but I'm not sure you know what it means.
When and where did typhoon Yolanda originate?
In a few moments I'm going to update this post to replace my dumb graph of Haiyan's path with one produced by Wunder Blogger Dr. Jeff Masters which should answer your question nicely.
What model did I use Greg? If you mean Trenberth's, then I was just using one of your sacred models to blow your twaddle away (do I think Trenberth's model is worth the paper it's written on? No, it just means that Climate God Trenberth disagrees with Climate Minion Greg).
The graphs I referenced show historic data (you know what I mean Greg - real data, not made up stuff).
The total energy/strength thing is a typical exercise in alarmist goalpost moving. We were constantly told that there would be an increasing FREQUENCY of cyclones. When that didn't happen, the alarmists decided to start shouting about energy/strength. I have to admit this was a mastertstroke of propaganda, as the data on energy and strength is way more variable (and therefore harder to measure) than simply counting the frequency.
Oh, and what does cool mean to you Greg? I thought the phrase 'to cool' meant 'to get colder'. Maybe I'm wrong.
In summary Greg, I think you're clutching at straws as you try to make excuses for the lack of warming in the land temp records that alarmists were always promising us would rise like a hockey stick ;)
That's it, I really am finished now.
It's been a blast. This blog is better than any stand-up comedian I've ever seen.
Oh dear. It looks like Andy has done a giant dummy spit. From the language he uses, it appears he gets all his science from climate crank blogs in any event.
He claims " We were constantly told that there would be an increasing FREQUENCY of cyclones."
My recollection of the IPCC reports is "stronger but fewer" for the reasons that Greg outlined.
From the 2007 WG1 SPM.
"Based on a range of models, it is likely that future tropical cyclones (typhoons and hurricanes) will become more intense, with larger peak wind speeds and more heavy precipitation associated with ongoing increases of tropical sea surface temperatures. There is less confidence in projections of a global decrease in numbers of tropical cyclones."
http://www.ipcc.ch/pdf/assessment-report/ar4/wg1/ar4-wg1-spm.pdf
Less confidence in the projection but definitely fewer. This statement is essentially repeated in the 2012 IPCC SREX.
I believe that Professor Kerry Emanuel from MIT is the one researcher who has a different view. Explained in the following article.
"These findings - that both the intensity and frequency of tropical cyclones could increase - are unusual. Most research suggests that while tropical cyclones could become more intense under climate change, the number of tropical cyclones is likely to stay roughly the same, or decrease."
http://www.carbonbrief.org/blog/2013/07/new-study-shows-not-all-models-…
But historical records show that tropical storms are not getting more frequent or more violent which you would assume was the case if global warming was effecting them.
Well, you're not correct in that. There are several temporal scales that have been examined by several researchers. One study showed that over 1,500 years Atlantic hurricanes were more common in recent decades and during the Medieval Warm period compared to other time periods (Mann et al 2009). Good records for hurricanes are probably only a few decades old, and climate change is something that would have started as early as the turn of the century (the last century, not this one), so looking at the last few decades of similar data is not that helpful. Having said that, studies of Pacific hurricanes (i.e. Emanuel 2005) show that there is a strong correlation between sea surface temperature and overall hurricane strength in a given season, and also that sea surface temperature has trended distinctly upwards over the last hundred years.
There are other studies as well, but the upshot is that there is evidence from the empirical record, if you don't cherry pick or ignore important data (like how strong hurricanes are rather than just their SS number) that both frequency and strength have gone up overall.
So, no, you've not got that right, Sean.