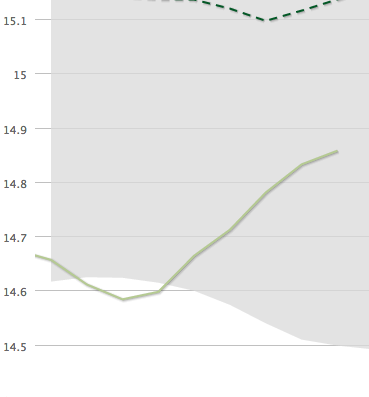
A few days ago I made a prediction for this year's minimum Arctic Sea Ice extent. That's still valid. Or not. Either way, it's still my prediction.
But looking at the ice over the last few days, we see that for the first time in a while the extent of ice estimated by the NSICD has stopped hugging the -2SD line and is rising upwards like a chilly Phoenix rising out of slush ashes. In fact, one could even say that Arctic Sea Ice has recovered! Just look at the last eight days of data!
Think I'm cherry picking? It's possible, let's look at the larger picture, over a whole year's cycle:
Well, even looking at the data at this scale, the sudden upswing in ice is still impressive. This happens frequently, but actually, not every year. Just now and then. Is there an explanation?
Of course there's an explanation! But I have no idea what it is and the ice experts are not saying much. I'm thinking this is just part of the normal up and down in either measurement error or actual freeziess of ice. Something like this could have more to do with wind than anything else.
This is the time of year, this week, maybe next week, when the maximum Arctic Sea ice extent is typically reached. We are actually past the peak day for some recent years. So keep an eye on this squiggle, it will start to drop soon.
There are several reasons this is interesting. One is the insight it gives in the psychology of climate change denialism. The extent of Arctic Sea ice is important in relation to climate change, so pretending that there has not been a dramatic drop in minimum extent over recent years is essential in order to keep the lie that climate change is not real up and running. Two years ago the drop in sea ice was extremely dramatic, and then last year, the drop in sea ice extent returned to it's usual merely alarming level, much lower than most recent years, continuing the downward trend. That caused denialists to scream and yell and dance and throw their arms in the air, claiming that the Arctic Sea Ice has recovered. This is roughly equivalent to watching a crash at a NASCAR race with metal flying everywhere, cars on fire, tires rolling away at high speed, but then one of the cars lands on it's bottom side instead of its top side and everyone goes "Look, there was no accident, yay!"
The main reason this is all important, though, putting the anti-science crowd aside (where they should be put) is simply the fact that as sea ice diminished from year to year, during the summer, the Arctic Sea warms even more, and the planet as a whole gets to warm a bit as well because of the exposure of the dark ocean waters and lack of bright shiny solar-energy-reflecting ice. This has cause the Arctic to warm faster than other regions of the planet. The differential of heat between the warmer equator and cooler poles drives and shapes our climate system. This "amplification" of arctic temperatures relative to the rest of the globe has almost certainly altered weather patterns, and mostly not in a good way.
So, expect more of that, perhaps.
Any bets on which day will be the maximum extent of Arctic Sea ice this year?
I'm going to say that using to the NSICD chart shown here, it will end up being March 19th, tomorrow.


3/22
#predictionfail. "But look at my charts and graphs of adjusted and interpolated facts!!!".
Just look at the daily average temperatures for Svalbard. Through february and very early march it was around 34F, way, way above average. Then suddenly one fine day earlier this month (march) daily mean temperature dropped, and has been hugging the single digits ever since. From one day to the next--average dropped about 25F and has just stayed there--at least through today. The day it dropped was the day fresh data came out about the shrinking ice cap--that it was looking like the beginning of a rapid descent. Suddenly since then the trend has turned around vis a vis ice cap, as you point out.