
I've got a new set of electoral college predictions. I'm using the same method as before, but with these differences: a) I had to use less than ideal polls (c rating, a few that overlapped with days prior to POTUS debate III) on the last run, this time no such polls are used; and b) there are some new polls added in this time.

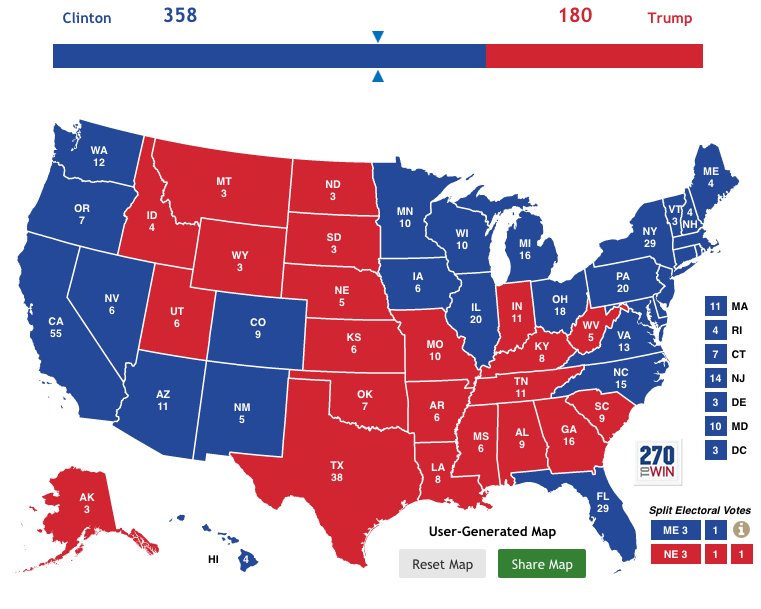
The difference is interesting, and somewhat concerning (compare to this result). For example, in this run, Arizona, Virginia, and New Hampshire go for Trump. Most people think of that as unlikely. Personally, I don't see Virginia doing that. New Hampshire is conservative and is very white (thus potentially Trump-leaning), but is in transition. However, these states are all within a very small fraction of the 50-50 cutoff. Oddly, North Carolina is not that close.
I did a second map (using 270 to win) with the same data but adding ca 3% correction for ground game. Trump seems to not have much of one. I asked a number of colleagues what percentage correction they might use for a good vs. bad ground game. These are people who have ground game experience and a good record. They were all over the place in their suggestions, and noted that any such guess would be iffy this year. So, I picked 3%. North Carolina is actually slightly more tha 3% of the 50-50 line, but I included it anyway in this latest run, which adds New Hampshire, Arizona, Virginia, Ohio, and North Carolina.
I want to remind you of a couple of things about this model. It is indifferent to your opinion as it might be derived from polls. That is the point. This is meant to account for some of that potential observational bias, or at least, ignore it. Also, this model tends to work ver well. However, it is accurate mainly with respect to the percentage of the vote assigned to each candidate in a unit area (a state), not whether the candidate takes the state or not. In other words, we look at this and freak out about a state being blue or red, and the model says, "Who cares about that, I'm trying to tell you the PERCENT of the vote per candidate. So, 49 vs. 51 are two points off, and 81 and 83 are two points off, they are the same, silly human!"
The real meaning of this particular prediction, which uses BETTER DATA POINTS than the last one but FEWER OF THEM, is that it is not a) closing in on a Clinton landslide -- that isn't going to happen and b) it shows the kind of crazy variation over time that should keep us up at night. On the 8th. But not so much other nights, because it is, essentially, impossible for Clinton to lose.
And, to underscore that point, here are the states that my model currently says will go to Clinton, on the stronger Clinton side of the distribution, that are the minimal needed to get 270 votes:
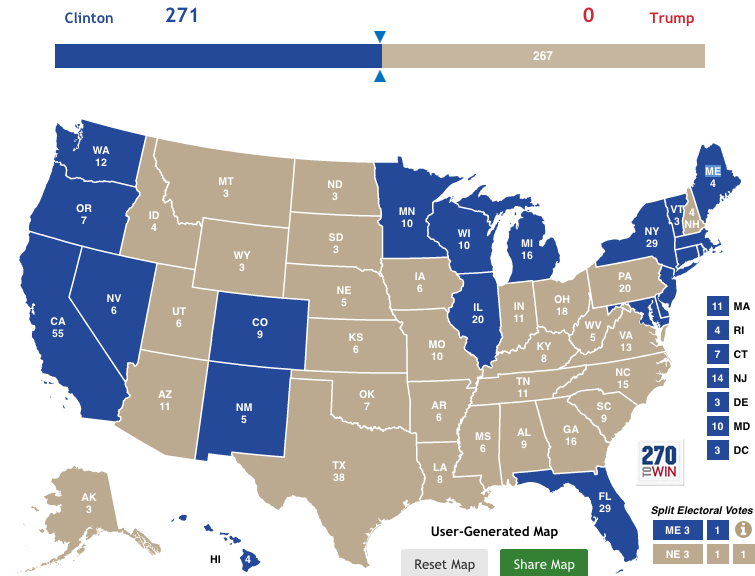
So, that's how Clinton can win without Pennsylvania or Ohio. And, again, this is the quirky nature of variation near the 50-50 line. Clinton will probably win Pennsylvania (according to everything) and couple of other states, and does not, therefore, need Florida. Probably.
I have no particular faith in your model, and 297 to 241 with Florida assumed to go for Clinton is not just concerning but terrifying. If your model is correct except that Florida flips to Trump, then Trump wins 270 to 268.
Your lack of faith is based on an argument from incredulity because you don't like the results for the swing states. If you read the background on where the model comes from, you'd have more faith. This is not a state by state decision based on each state's polls. This is a totally different approach.
I expect a lot of odd results in the states that are close, but that should settle down as we approach election day.
But you should be terrified. The model is going to be somewhat randomized near the 50-50 line, as to which state goes to which candidate (as discussed). But it is not going to be that far off over all.
This election is not clearly a runaway, despite a lot of arm waving suggesting it is.
Looks like Trump is leading in the Florida exit polls, and is gaining in Nevada. If he wins these two states he beats Hillary 276 Trump, and 262 Hillary according to the map above.
Chris: There are no exit polls for Florida.
Florida could go to trump, but before that, Virginia is going to go to Clinton.
Oopsie
http://www.zerohedge.com/news/2016-10-28/fbi-said-reopen-probe-hillary-…
"The FBI has learned of the existence of emails that appear to be pertinent to the investigation."
After being briefed by his investigative team, Comey "agreed that the FBI should take appropriate investigative steps designed to allow investigators to review these emails to determine whether they contain classified information, as well as to asses their importance to our investigation." Comey said he could not predict how long it would take the bureau to assess whether the new emails are "significant."
Greg, your tendency to jump to conclusions when disagreed with is showing. I did read the explanation, and my doubt is not an Argument from Incredulity, much less one derived from "not liking the results." (Do you think I do not like them because they show Clinton losing potential swing states? Seems to me I expressed a fear that that could happen way back when the DNC was working hard to make sure Bernie didn't get the nomination, and was pooh-poohed.)
Your model may well be superior to poll-based models, though it's somewhat deterministic and therefore effectively presupposes continuation of business-as-usual. However, my doubt is based upon the fact that it hasn't been fully tested in even a single national election. (Unless I did not observe, or have forgotten, that you were already using it in 2012?) You accurately predicted Clinton's victory in the primary, but primary voters are a non-random subset of all voters. I want to wait and see how it compares to the real outcome before trusting it too far. Otherwise, it would indeed be a thing taken on faith alone.
"Greg, your tendency to jump to conclusions when disagreed with is showing. "
I never do that!
"the fact that it hasn’t been fully tested in even a single national election. "
It is possible that I tested this on the last few elections.
(That's actually something I could try, just don't have time)
"indeed be a thing taken on faith alone."
Actually, no, it is not based on faith alone. There are reasons to trust this model. You've set up a specific reason that would convince you trying it out for -- how many, 30? -- election cycles. An empirical test based on performance alone (else only faith convinces) means that most other approaches have sample sizes, of previous tests, of one or two.
By the way, a number of other recent estimates come very close to mine now, with some of the "that can't be true" states left in limbo (which I simply decided to not do). (AP, CNN, Cook, NBC, NPR, for example)
I don't know where you get the number 30. Polls are far from perfect, but usually a candidate who is winning in the polls wins the popular vote. When they do not, it is sometimes because the pollsters' premises, e.g., assumptions about what percentage of each demographic subgroup will vote, have been wrong. I do not see an a priori reason to assume that your model is immune to such errors, because human behavior is changeable.
Jane, I'm certainly not claiming that my model is immune to such errors. I'm saying that track records are not as important as to say what you said, which is with no track record, you get zero faith.
538 has been using their general method for two election cycles, and the actual probabilistic method they use now, for one, I'm pretty sure. So, their sample size of prior elections is one. Mine is zero. Theirs is only one more than mine!
Greg, what's your opinion of the "probability of winning" numbers that are at the top of the page on DailyKos.com (the leading progressive Democratic site)?
At this very moment they show a 95% probability of HRC winning, and a 64% probability of Democrats re-taking the Senate. I don't know the methodology they are using so I have to remain skeptical pending yours or some other credible critique of it.
Re. the latest "email thing," the MSM appear to be mis-reporting it to stir up the usual horse race horse s***. Comey has reported that he found some HRC emails on a computer used by a high-level staffer who is the estranged wife of Anthony Weiner, while investigating the latter's latest misdeeds involving his eponymous member. The MSM are making this look like another Big Hillary Scandal, "re-opened the criminal investigation into HRC's email," and blah blah blah. Humans are emotion-seeking animals, so emotions sell and drama in particular sells. The MSM are engaged in brinksmanship to the point of existential threat.
What do you think the impact of that will be?
Any more October or November surprises in your sights?
Bloody hell I wish this was o-v-e-r.
I don't trust 538's probabilistic method either.
Before answering about the probability thing, we need to do a thought experiment.
Imma give you $100 if you do one thing.
First let's try this. You get $100 if you eat a cookie. That's a easy one.
Now I'm going to take you out to a lonely country road, put a blindfold on you, and tell you to walk across the street for the $100. Another easy one.
Now, I'm going to take you to a moderately busy highway, Count how many seconds go by between each car passing on average. It is a Sunday afternoon, so it is about 10 second. But it is a four lane highway.
Blindfold on, I point you towards the highway, and you walk across it ... at a normal walking pace ... for the $100
That should be an easy one too, because nobody is going to run you over. They can see you. there aren't' enough cars for them to run into each other to avoid you. You can do this. The chances of injury for you are pretty low.
But, you are not going to do it. You still have the other $200 and half the cookie.
The chances of Trump winning, if the probability statement says that Hillary has an 85% chance, are way, way higher than the chance of you getting run over on that highway. Ten times higher, maybe a hundred times higher.
Personally, I think the method is fun, and all, but I also think it is very misleading.
First, people instantly confuse it with polling data. SO, they see "85%-15%" and equate that with a poll that shows similar numbers, like Clinton in DC.
But also, people think it is the chance of winning, when it is in fact only partially a chance of winning. It also incorporates error and the chance of the polls being accurate, which is not exactly the same thing.
What I prefer to look at it 538's adjusted, weighted polls-only data. That is simply looking at the polls intelligently. That's a good idea.
You are correct that I personally won't walk across the highway, because I have way more than $200 in the bank already. Other people might choose differently, because facts mean nothing except when viewed through the lens of individual values and interests.
As of five minutes ago, 538 gives Drumpf a polls-only 28.7% chance of winning and a polls-plus 30.6% chance. AAAAAUUUGGGHHH! Time to start looking for an overseas job.
Don't leave... Unless you can take the nukes with you.
(Where did you think he was going to fire them??)
He'll fire them at non-white oil-possessing countries that, contra his constant lies, have no nukes to fire back. But the question will then be whether Russia and/or China at that point recognize the absolute necessity of going for a first strike on us, accepting the cost of major devastation to their own countries. I suspect they will.
My issue with 538 isn't their probabilistic method. As far as I can tell, they determine those probabilities by running Monte Carlo simulations and finding that Trump wins X% of those simulations, so they say that Trump has an X% chance of winning. The Monte Carlo technique is a well-established method for determining the probability of some outcome when analytic methods are difficult to implement. Other sites following the race probably use their own Monte Carlo simulations with different assumptions, and they get different distributions.
The issue I have with 538 is their assumptions. They seem to think a large systematic error in all of the polls is substantially more likely than other sites do. The effect makes their tails especially fat--not only do they give Trump a larger chance of winning, they also give Clinton a chance of winning by 10 or more points, which I also find highly improbable.
The idea that there may be a systematic error in the polls is not unreasonable on its face. In reporting poll results, pollsters will have applied some kind of likely voter model, and the outcome of the poll does depend significantly on that model (it can swing the poll result by several percent--in most cases, the whiter the LV model, the better Trump does in a given state). It also makes since that this error is systematic: a given polling organization whose likely voter model is off in one state will probably have similar issues with their models in other states. Silver tries to correct for this with a "house effect" adjustment; e.g., Rasmussen tends to report results that are a couple of points or so more Republican than others, so if they report that a swing state is tied, 538 will treat it as a Clinton +2 poll (other aggregators, such as Sam Wang, do not make this adjustment). We have no way of knowing, prior to Election Day, whether a given pollster's bias is relative or absolute. But the bottom line is that I think the effect is not as big as Silver thinks it is.