
tags: Grab More Science, LabGrab, science news, technology, graphic, image of the day
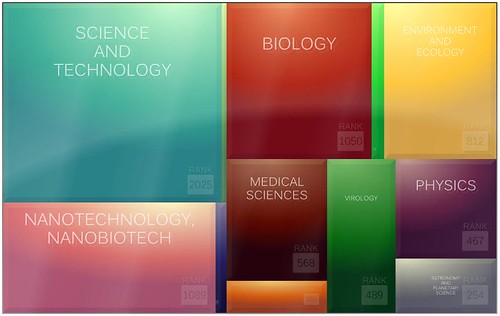
Image: LabGrab, 13 January 2010.
An American start-up company in Portland, Oregon, announced the release of their new technology that creates a colorful chart to visualize the volume of science and medical stories published by discipline (above). The boxes are defined by discipline and their sizes are determined by the total number of article headlines published by universities, journals, science news aggregators, and science blogs within the given time period (as defined by the user).
"We read a statistic that roughly 10,000 items of science news were published daily and thought it would be intriguing to animate that day after day" says Jed Herzog, lead developer on the project.
"Grab More Science" was the result. A comprehensive database of content generated by their web 'bots, "Grab More Science" was developed by asking users to identify relevant web sites, science blogs, RSS feeds from universities, and scientific journals. Using these data, the "Grab More Science" graphic creates a graphic depicting a collection of daily science news. When moused over, most boxes display several subcategories within each discipline.
"Our thinking is that great tools already exist for finding citations, keywords, and authors," explains Herzog. "What we want to build is a personalized discovery tool for science professionals and enthusiasts."
LabGrab's goal is to bridge information gaps between that laboratory, industry and the public, and in doing so, seeks serves to promote services and products in the most productive ways possible. To do this, LabGrab works to find the most interesting science news and to nurture a collaborative community that seeks to improve existing technologies and to develop new innovations. They already have developed partnerships with organizations such as The Research Triangle Park in North Carolina and Massachusetts Institute of Technology in Boston, MA. If you would like to become part of their community, simply go to their site and register to set up your own profile for free.
Sources:
Now if they could just tweak their software to use dark lettering (or dark outlines around each letter) on the topics shown with light coloring, they'd be Web-ready.