
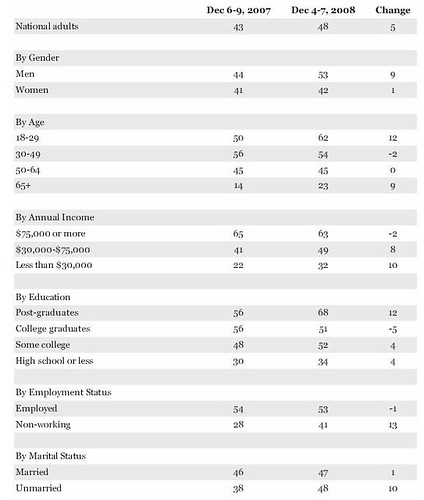
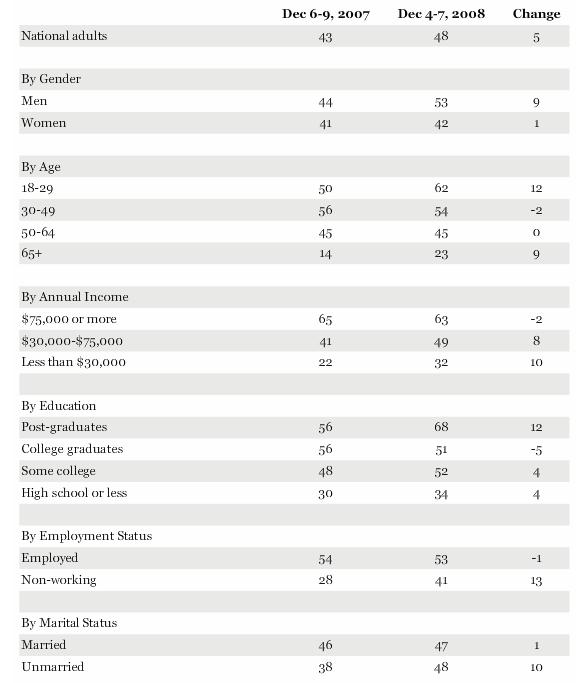
Gallup has released a poll that shows that the percentage of Americans who use the internet for more than an hour has increased to 48 percent. But some of the claims of change in use by demographic group puzzle me--I don't think they're significant.
First, the data (percent who use the internet for more than an hour per day):
(click here to embiggen)
Some of the changes don't really make sense to me. Does anyone really think that the number of 'heavy' userpost-graduates (Ph.Ds, masters, laywers, M.Ds) increased by twelve percent over the last year? Or that unmarried users increased by ten percent? I'm thinking that the statistical caveat that
Gallup adds isn't correct:
Results are based on telephone interviews with 1,009 national adults, aged 18 and older, conducted Dec. 4-7, 2008. For results based on the total sample of national adults, one can say with 95% confidence that the maximum margin of sampling error is ±3 percentage points.
Isn't that three percent sampling based on the total survey numbers? In other words, that three percent error estimate only applies to the general and universal question, "Do you (regardless of demographic group) use the internet for more than an hour per day?" Once you start breaking out demographic groups, don't you have to use the sample size of the group? In other words, if your survey only speaks to 100 post-graduates, then you have to estimate sampling error as if there were 100 respondents.
Also, the 'real' frequency of use should matter--the error rate will be determined by the underlying frequency of the phenomenon.
At the very least, Gallup should release the number of respondents in each class.
"I'm thinking that the statistical caveat that
Gallup adds isn't correct:"
The caveat seems completely *correct*, it just isn't much use. It says that the +/- 3% is valid "For results based on the total sample of national adults".
Also not that they mention maximum margin of sampling error. For questions with a frequency closer to 0% or 100%, the real margin of sampling error may actually be much smaller.
Yes, knowing the number of respondents in each class would help. A better tradeoff between the needs of amateur statisticians and the average reader might be to print the differences that are actually significant in bold.