Back in December, The Parable of the Polygons took social media by storm. It's a simple little demonstration of how relatively small biases can lead to dramatic segregation effects, using cute cartoon polygons. You should go read it, if you haven't already. I'll wait.
This post isn't really about that. I mean, it is, but it's using it for something dramatically different than the intended purpose of the post. You see, I am such a gigantic dork that when I looked at their toy model, the first thing that came to mind was physics.
(And, in fact, I sat on this post topic for the better part of a month, just because it's a serious and worthwhile post, and I didn't want to look like I was just taking the piss. It's been around enough that I hope everybody got the main idea, and I can repurpose it without seeming disrespectful...)
You see, this sort of model with two types of things that live on vertices of a lattice and interact with their neighbors is a very popular toy model in physics. It's close to but not exactly the same as the famous Ising model for spins in a magnet. Having this sort of thing all coded up and ready to play with is pretty cool, so I scrolled down to the "big sandbox" part and started trying to break it.
One of the most interesting phenomena that happens with Ising-type networks of interacting spins is "frustrated magnetism," which lots of people put time into simulating-- I wrote up an experimental demo a few years ago. The idea is that in some configurations, it can be impossible to find a scenario where all the spins can be aligned in such a way as to minimize their energy. The simplest example is a triangular system where each spin wants to point in the opposite direction from its neighbor. You can get two of them in the proper relative orientation, but the third has nowhere to go.
This polygon game isn't exactly the same-- the polygons don't change type, they hop from one site to another, vacant site if too many or too few of their neighbors are the same shape-- but it's similar enough that I wondered whether I could find some conditions where the simulation couldn't find a "happy" final state.
The first order of business was to figure out the rules of the simulation, specifically how many neighbors you count. In the simplest square-lattice Ising model, you only count nearest-neighbor interactions, so each point has four neighbors (one to the left, one to the right, one above, and one below). The next step up is to add "next-nearest neighbors" which would be the four diagonals, or eight "neighbors" for each point.
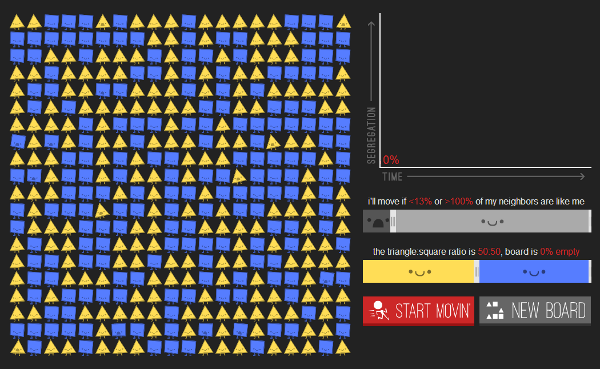
So, how many neighbors does the polygon parable count? Well, here's a grid with no blank spaces, and polygons who get unhappy if fewer than 12% of their neighbors are the same shape:
And here's the same grid with the threshold bumped to 13%:
You can find a couple of yellow triangles in there completely surrounded by blue squares, who go from "happy" to "unhappy" when the threshold is raised. This suggests that the relevant number for calculating percentages is eight neighbors (so one neighbor is 12.5%). This is complicated a bit by the addition of empty space to the model, but for simplicity, I'll talk about everything else as if the shapes have eight neighbors.
So, how do we break the simulation? Well, the way it works is that on each pass one of the "unhappy" shapes will jump to a vacant spot, while "happy" shapes will stay where they are. The simulation runs until this produces a configuration where all the shapes are happy, assuming it can do that. Obviously, the more picky the shapes are, the harder it is to find such a configuration, and at some point the whole thing should break down-- it obviously has to fail if the shapes want more than 87.5% or fewer than 12.5% of their neighbors to be the same as them, but you might expect a practical implementation to break down somewhere before those thresholds.
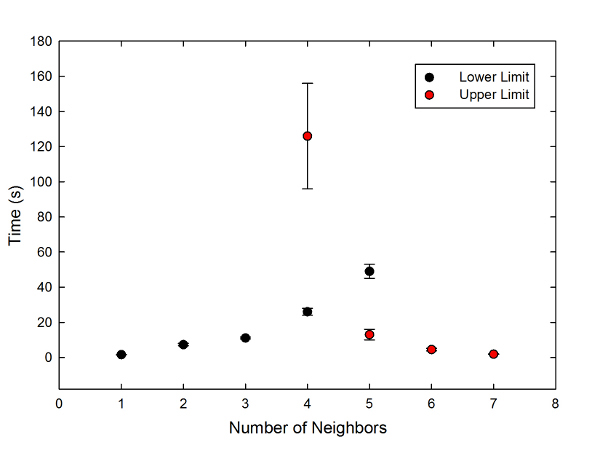
Now, of course, there's a halting problem issue here-- it's impossible to say whether a particular configuration will necessarily fail to produce a solution, as opposed to just not finding one yet. But as a proxy for this, I decided to measure the time required to settle into a "happy" configuration as a function of the minimum or maximum number of neighbors of the same type. It wouldn't be science without a graph, so:
 Time required to find a "happy" configuration for some minimum number of neighbors of the same shape (black points) or some maximum number of neighbors of the same shape (red points).
Because this is random, I ran five trials for each; the error bars on the graph are the standard error of the mean of the five. Though that's understated for the top red point, for reasons I'll get to in a minute.
You can see that the simulation converges very quickly for extreme values-- for a minimum value of one neighbor or a maximum of seven, it's only a second or two. The time increases as the shapes get more demanding, and eventually blows up. I never got it to converge for a minimum number greater than five, or a maximum less than four. In fact, the maximum-of-four point is underestimated-- two of the five trials I did never settled down within the three minutes I allotted.
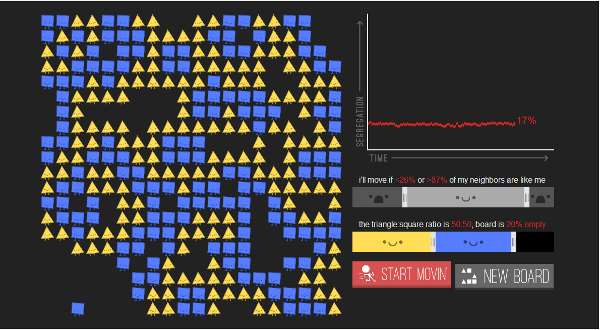
The diversity-demanding shapes produced some cool patterns, which sort of point to why the problem is so much harder in that case:
You can see that this leads to a set of stripes, so that a typical shape has only two neighbors of the same shape. This pattern is completely self-organized, which is pretty cool.
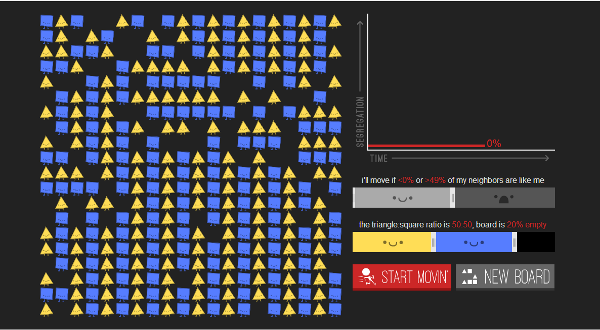
Now, the model allows you to set both upper and lower limits. This obviously gives an awful lot of parameter space to play with, but because I didn't want to spend infinite time on this, I decided to fix the maximum number at seven neighbors of the same shape (or, if you prefer, demanding at least one neighbor of a different shape), and vary the lower limit. This produced patterns like this:
 Pattern for shapes demanding at least two neighbors of the same shape, and at least one of a different shape.
Unfortunately, I was only able to get two data points. Requiring one of each converged within about 3.5 seconds. Requiring two of the same shape and one of the other shape took anywhere from 35 seconds to more than three minutes, and I never got a solution with a minimum of three and maximum of seven to work, even when I left it running while I went and took a nap for an hour and a half.
Other things you could investigate with this include the influence of changing the amount of empty space-- I kept it at 20% for these, because that gave reasonable convergence times. Reducing that to 10% increased the time slightly, and increasing it to 40% reduced the time a bit. I also kept the mix of squares and triangles at 50/50 for all of these tests, but you could obviously complicate things by putting in more of one or the other. Feel free to run your own tests, and send the results to Rhett for grading
So, what's the take-home message, here? Well, pretty much the usual: if you look for it, you can find physics in just about anything. Even the social interactions of imaginary polygons.


