A little while back, I used a photo of SteelyKid's toy Newton's cradle as the photo of the day, with a bonus video:
I mentioned that I was going to do some analysis of this at some point, but didn't have time right then. I had a bit of time to poke at this yesterday, though, so here's some physics making use of the normal-speed part of that video (I have another purpose in mind for the high-speed stuff; you'll need to wait for that).
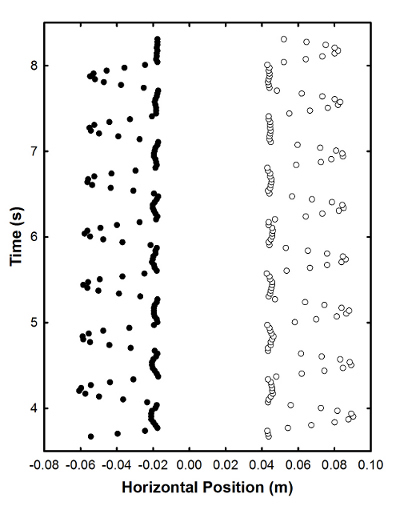
The obvious thing to do with this is to plug it into Tracker and measure the position as a function of time. Here's a graph tracking the position of the two end balls through several bounces, mostly just because it looks cool:
You can see the key behavior here, namely that the two alternate bouncing out really far, and also some real-world complication, namely the slight rebound motion of the two in between big bounces (this might be because I tugged it slightly to the side just as I started it, which made all the balls start swinging). But, like I said, it's mostly just a pretty picture.
So, what's a more interesting physics question to look at? Well, the obvious departure from the perfectly ideal situation is that the balls don't keep bouncing forever, but slow down and stop. This happens because some of the energy of their motion gets shifted into other forms-- carried off by sound waves as the balls "clack" into each other, converted to heat that increases the temperature of the balls and the air around them, and converted into collective motion of all the balls together. so, how can we look at that?
Well, the pendulum nature of the toy gives you a really nice way to monitor the energy content. At the extreme end of each swing, the full energy of the system is converted into gravitational potential energy of the ball at the end. That's simply proportional to its height above its stationary position (Ug=mgh where g is the strength of the gravitational field and h the maximum height reached by the ball of mass m). That maximum height is something I can read directly out of the Tracker files, meaning it's easy to make a graph of the energy content as a function of time.
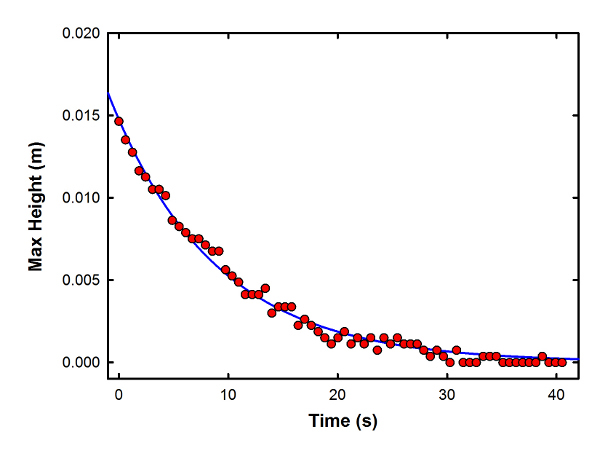
So, I measured the position of the ball on the right end of the toy at its maximum swing for some 68 bounces. The criterion for picking the frame with the maximum swing was to look for the least motion blur-- if my reflection in the ball was clear and sharp, that was the frame to use. I also measured the position of the end ball for four frames before the first bounce, and averaged those to get the zero position, which let me make this graph of maximum height as a function of time:
 Maximum height of the right-hand ball (which is proportional to the gravitational potential energy) as a function of time.
(I could've converted the vertical axis to energy directly, but to do that I would need the mass of the balls, and that's annoyingly difficult to measure cleanly. So I'm being lazy and leaving it as height, which is proportional to energy.)
As you can see, these trace out a very nice exponential decay function-- the solid line is an exponential fit, with decay constant of 0.103+/-0.002 1/s. That's a time constant of about 9.7s, if you prefer something you can easily compare to the graph.
So, does it make sense that this should be an exponential? Well, an exponential function is sort of the default assumption for just about anything that decays-- there ought to be an "every decay is exponential" folk theorem in the same way that the Central Limit Theorem is semi-seriously used to justify fitting every distribution with a gaussian. But it does make a certain amount of sense-- the more energy in the motion, the more violent the collision, and the more energy goes into sound and heat and other dissipation. Which might lead you to conclude that the energy lost at each step should be proportional to the energy available, and if that's the case, you naturally get an exponential decay.
Given that, I could reformulate this fit to ask how much energy is lost on each bounce. The graph that goes with this is basically identical to the one above, just converting the vertical axis to a percentage of the initial energy and the horizontal to bounce number. So, I won't bother putting it in the post, and will just quote the key result that the exponential decay constant is 0.063 +/- 0.001. Which corresponds to a loss of 6% of the energy with each measurement, or 3% per bounce (since there's one collision at each end between measurements of the maximum height). That's a number that seems pretty reasonable, though admittedly, I don't have a lot to base that on.
So, there you go: a more detailed look at the physics of energy in a popular desk toy. As I said at the start, I have another plan for the high-speed portion of this, that I hope to reveal this weekend over at Forbes. While you wait for that, why not take a few minutes to fill out the science blog reader survey for Paige Jarreau's postdoctoral research on online communication? It doesn't take long, it's for SCIENCE!, and she's offering some cool giveaways.


Coefficient of restitution for steel spheres is in the high-ninties (Lifshitz, J. and Kolsky, H. (1964). Some experiments on anelastic rebound).
The little rebounds naturally happen for the Newton's Cradle (though the magnitude of this may be affected by your push). It always spalls.
The damped ossillator differential equation gives exponentiially decaying solutions. This isn't exactly a mass-spring-dashpot system but that's where I'd start to model it. I wonder how the packing or number of balls would influence the decay rate.
You might be interested in Mythbuster's attempt to scale up Newton's Cradle to wrecking ball size... see http://www.discovery.com/tv-shows/mythbusters/videos/newtons-crane-crad…