The last 100 years have brought us from a Universe no bigger than the Milky Way ruled by Newton's gravity to a vast, expanding one with hundreds of billions of galaxies, covered in dark matter, beginning with the big bang, which was likely caused by inflation, and which will end in a freezing cold death as the galaxies accelerate away from one another, off into infinity. We gained and confirmed a new theory of gravity; we learned how all the elements in the Universe were made. We detected neutrinos from an exploding star hundreds of thousands of light years away. And we walked on the Moon.
And, while wherever possible, I've tried to give credit to the individuals who've bore the most responsibility for these advances, the truth is that -- for almost all of these advances -- there are tremendous teams of unsung people behind nearly all of them.
This century, nearly all of the great satellites, observatories, computer simulations and experiments that are returning tremendous amounts of scientific data about the Universe -- from our own Solar System to the farthest reaches of space -- are run by huge teams of scientists, not just a few individuals. So for the greatest discovery of the 2000s, I choose the most important satellite, the Wilkinson Microwave Anisotropy Probe, or WMAP.
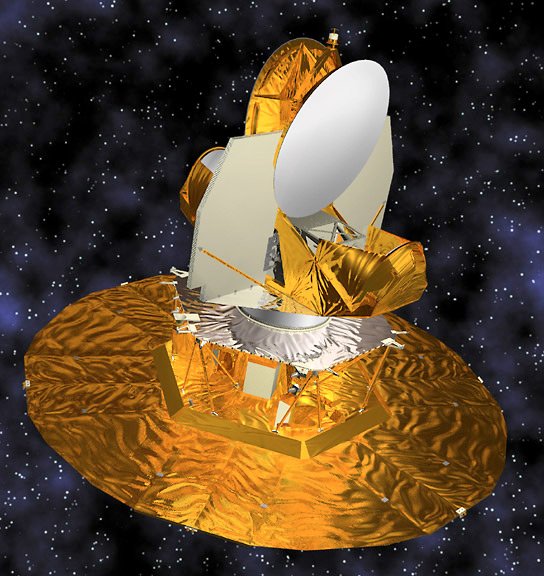
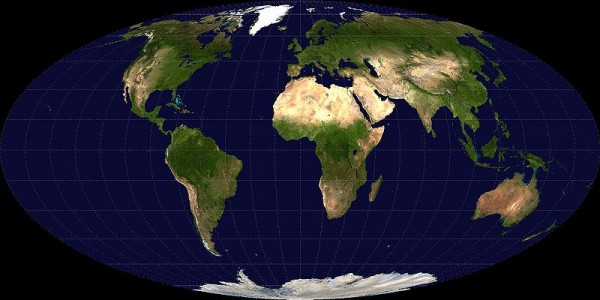
WMAP is pretty simple: it's a telescope designed to observe microwave light from two different points in the sky at the same time. We can use it to map the entire sky. Why is this important? Here's the problem: right after the big bang, the Universe was hot, dense, expanding, and very, very smooth. Let me show you what I mean. The Earth is a sphere, but -- of course -- I can't show you a sphere with just two dimensions. So we make a projection. Ideally, I'd like to show you a map that has the right area for all of the continents and bodies of water, unlike the Mercator projection you're used to. So I can make a map like this:
And that's pretty good! If we look at the heavens, in the optical and infrared, and map out where everything is, we can get a map of the sky! That big thing in the middle is our galaxy, but all the other stuff is made from the other galaxies we find in the Universe. This is a fantastic picture, so click here for the full resolution version:
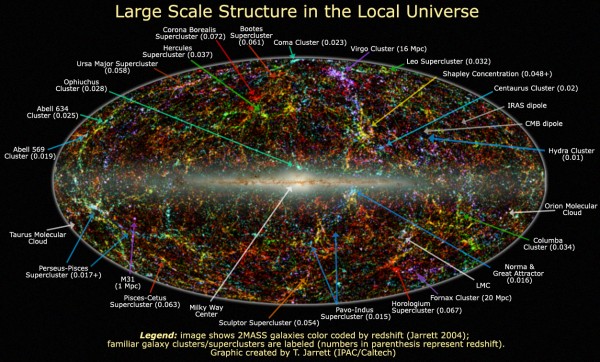
You'll notice, as you might expect, that galaxies are clumped together in groups. This is a picture of the Universe today, when it's 13.7 billion years old. Well, the microwave sky is, as you might remember, is the leftover glow from the Big Bang. But it's a very special relic from the past, because it hasn't changed since the Universe was only 380,000 years old! So when we see the microwave sky, we see the Universe as it was when it was only in its infancy. What did it look like back then? Well, from 1964 to 1979, we knew it looked like this:
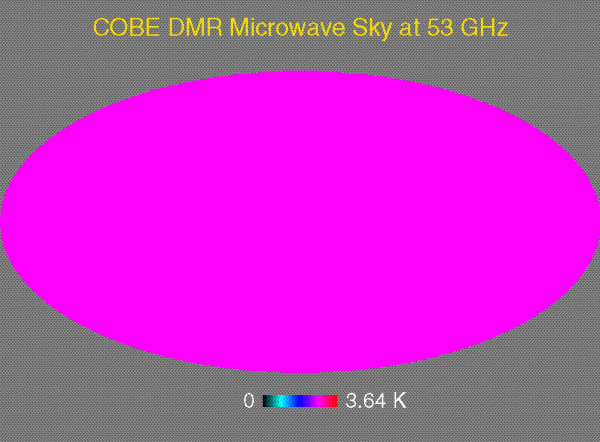
Well, crap. That can't be right. What we saw is that it was the same exact temperature -- 3 Kelvin -- everywhere. In the early Universe, though, temperature is related to density. If it's the same temperature everywhere, then it's the same density everywhere. But if it were really the same density everywhere, we would have clusters of galaxies in some places and absolutely nothing in others. In other words, there must be differences in density (and hence in temperature) to give rise to the Universe we see today.
In 1979, we discovered that one side of the sky is hotter than the other, if only by a few thousandths of a degree.
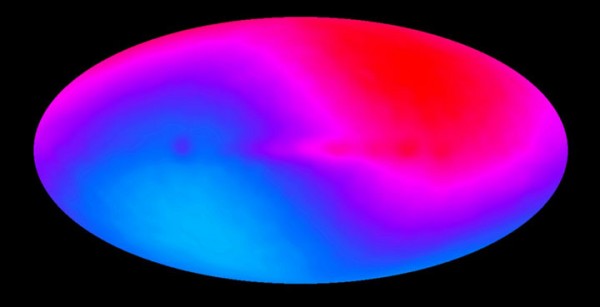
This just means that we're moving relative to the Hubble flow (i.e., expansion) of the Universe, at a few hundred kilometers per second. Where did all of these seeds for structure come from, though? In the 1990s, the COBE satellite gave us a hint, showing us differences of a few hundred-thousandths of a degree:
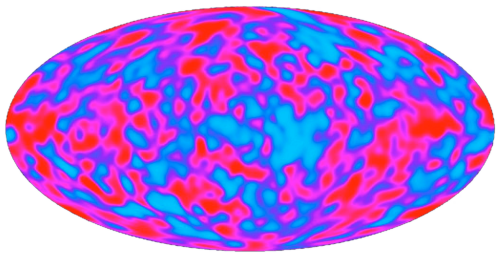
But this was pretty low-resolution. WMAP came along, and here's what the microwave sky (with the galaxy removed) looks like today, because of this satellite. (It's a huge image, click here for the full resolution version!)

So... umm... wow. The stars, galaxies, and all the structure in the Universe that we have today came about because of fluctuations just a few hundred-thousandths of a degree in the early Universe.
The science that came out of WMAP was also unprecedented for cosmology, allowing us to determine that, among other things, the Universe is:
- Less than 5% normal matter (protons, neutrons, and electrons),
- Made up of about 22% dark matter,
- which isn't neutrinos (at least in the conventional sense),
- and about 74% dark energy,
- spatially flat (as opposed to closed or open),
- and has been transparent to visible light only since a redshift of 10 or so, among other things.
There are many other interesting science discoveries that came out of WMAP, but it really helped cement our picture of the Universe and precisely measured a number of incredibly interesting things for the first time. And that makes it the most important discovery of the last decade for me.
Hope you enjoyed the series!

Great series Ethan, thanks!
I really like that elliptic projection.
But I don't get why there aren't more interactive maps on the net? How hard can it be to put this stuff on a sphere that I can rotate with my mouse?
There are 3D models for Google Earth and Worldwide Telescope here.
Loved the series! I'm sad it's over =(
Great post.
I have this nagging doubt about the CMB. The dipole is easy to subtract from the WMAP signal. Sines and cosines, no trouble here. I get that.
Well, you skipped an image here (like this one, from COBE http://map.gsfc.nasa.gov/media/990166/index.html ). This is the allsky map after subtracting the dipole, clearly showing milkyway emission.
My doubt is, how do you subtract the milkyway emission to get the final CMB image? It does not seem like the easy task of subtracting the dipole! How can we discriminate what is milkyway emission and what is the CMB?
Another related question: Does the microwave light from the CMB really crosses the bulge of the galaxy, just like that?
I don't know! Can you help me?
Thanks!
Terrific series - The Last 100 Years.
Keep on going. Give us: The Next 100 Years!
great series. I really appreciated the interplay between personality and invention, and you described it well.
This series was a great idea, and very well done. I look forward to the next one.
I've never understood how from that picture of the WMAP results, you can determine what the contents of the universe are.
@Andre: Most of the matter in the Milky Way is in objects which are much hotter than 3 K and therefore emit very little at the relevant wavelengths. So there is no galactic signal to subtract out. There also isn't any significant absorption at these wavelengths. If these assumptions were not valid, you would see a feature corresponding to the galactic plane in the WMAP results, and there isn't one.
Eh.
Thanks, Eric!
But take a look at this: http://map.gsfc.nasa.gov/media/poster2002/WMAP_poster2002a.jpg
On the left, there are the 5 "raw" images from each of the channels of WMAP (dipole already subtracted). The galactic emission is very clear in all of them. Yet, on the final image, in the center, it has been subtracted.
So, my doubt persists, hehehe
Anyone?
@Andre: The CMB is the same in all 5 single band maps but the Milky Way is stronger at low frequencies. So if you take a fraction of a low frequency map and subtract it from a high frequency map, you get rid of the Milky Way. You also got rid of some of the CMB, so multiply the result by a factor to adjust for this. If the Milky Way had a constant spectrum this would work perfectly, but there are spectral variations so the result is not perfect but only pretty good.
Ethan, your history of the discovery of the dipole is incorrect. It was first seen in 1969 by Ned Conklin, confirmed and extended by Paul Henry (doing a PhD with Dave Wilkinson) in 1971, reconfirmed by Corey and Wilkinson in 1976, and then measured quite well by Smoot etal in 1977.
See http://www.astro.ucla.edu/~wright/CMB-dipole-history.html
@Nick:
You might try to look here:
http://map.gsfc.nasa.gov/mission/sgoals_parameters.html
(and the subsequent pages)
You say "In the early Universe, though, temperature is related to density. If it's the same temperature everywhere, then it's the same density everywhere. But if it were really the same density everywhere, we would have clusters of galaxies in some places and absolutely nothing in others."
Was that "we would have" supposed to be "we wouldn't have"?