
"Cosmology is the study of the origin, evolution, and fate of objects in the observable universe. [...] The key to the birth and evolution of such objects lies in the primordial ripples observed through light shining through from the early universe." -Wayne Hu
The Big Bang’s leftover glow -- the cosmic microwave background (CMB) -- is the great cosmic gift that keeps on giving. When it was first discovered in 1965, it validated the Big Bang and taught us that our Universe as-we-know-it had a birthday. When we measured that the CMB looked hotter in one direction and cooler in the opposite, we learned how quickly we were moving through the Universe.
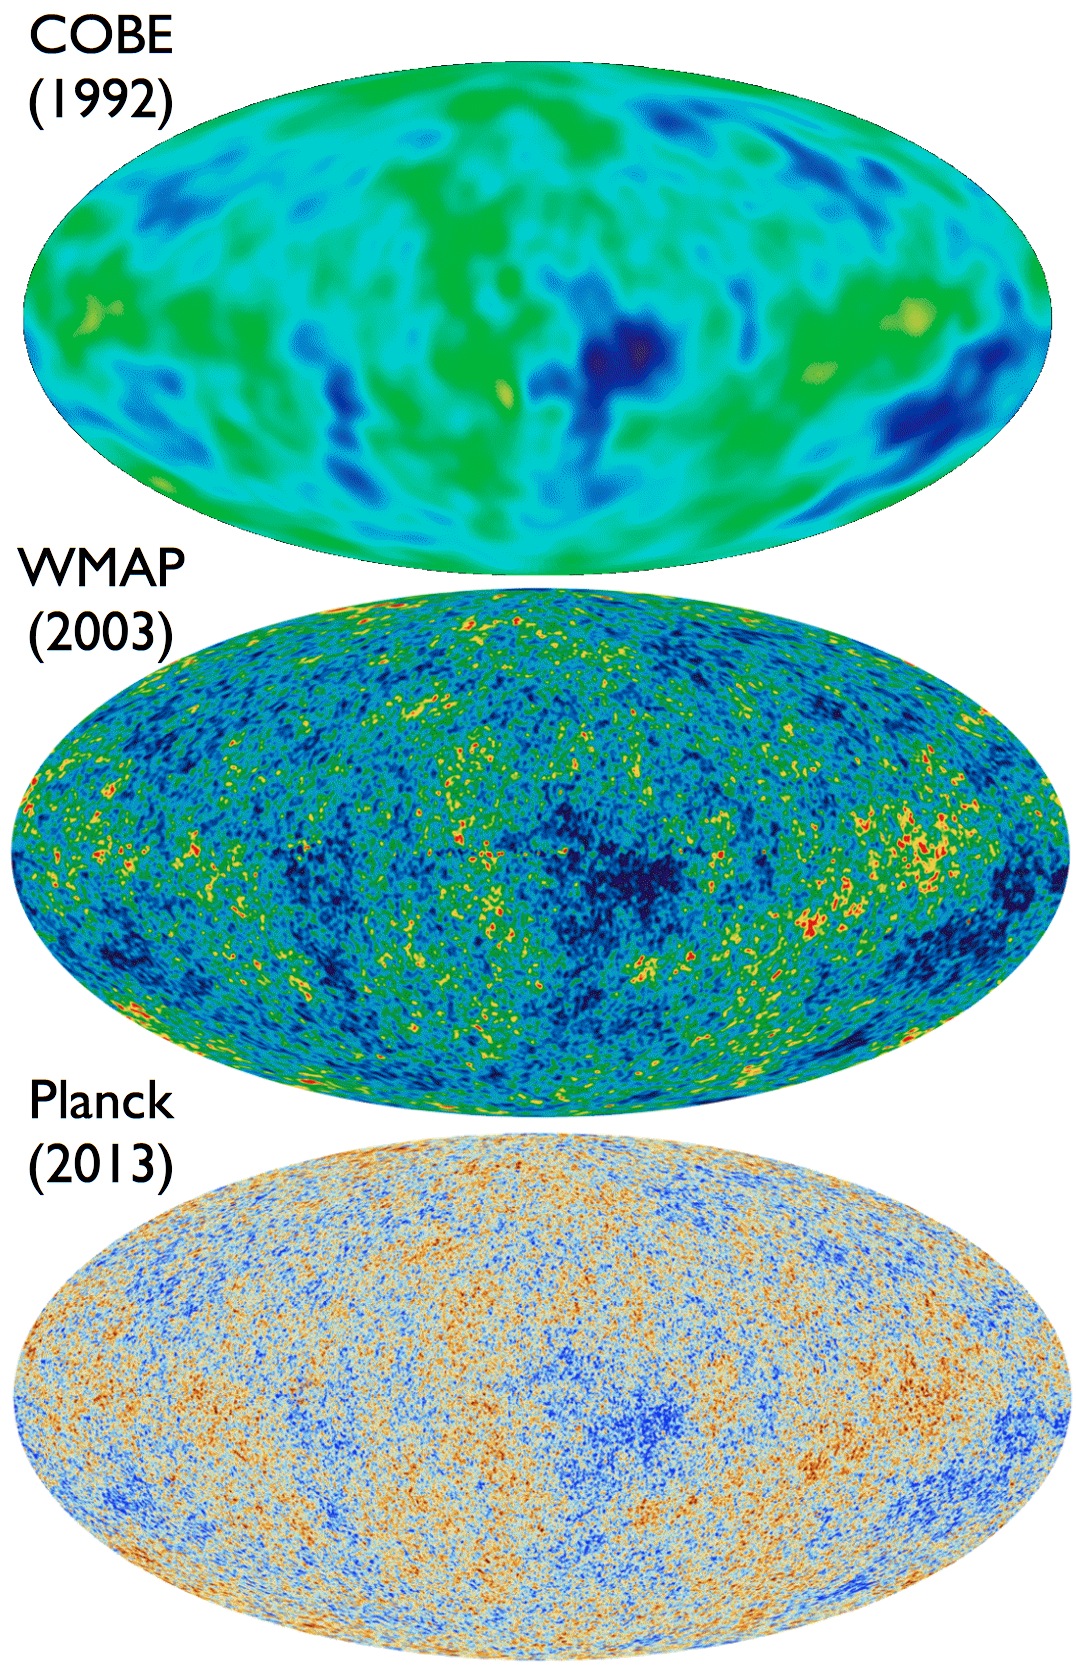 COBE, the first CMB satellite, measured fluctuations to scales of 7º only. WMAP was able to measure resolutions down to 0.3° in five different frequency bands, with Planck measuring all the way down to just 5 arcminutes (0.08°) in nine different frequency bands in total. Images credit: NASA/COBE/DMR; NASA/WMAP science team; ESA and the Planck collaboration.
And when we detected the tiny, µK fluctuations on even smaller scales, we began to learn how our Universe came to be this way. Thanks to the improvements brought by WMAP and Planck, as well as the advances in theoretical calculations that occurred contemporaneously, we began to measure exactly what made up the Universe. In the end, a single picture emerged: 5% normal (baryonic) matter, 27% dark matter and 68% dark energy.
 The power spectrum of the fluctuations in the CMB are best fit by a single, unique curve. Image credit: Planck Collaboration: P. A. R. Ade et al., 2014, A&A.