
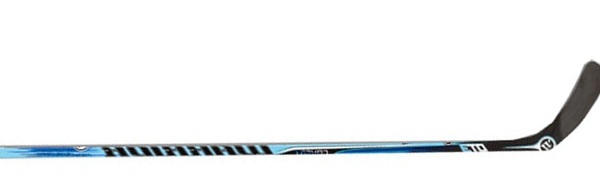
This is a hockey stick:
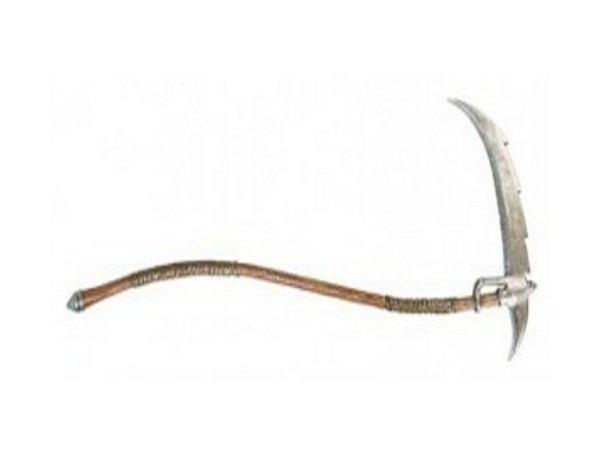
This is the Grim Reaper's Scythe:
This is global temperature over the last 10,000 years projected into the immediate future using good scientific estimates:
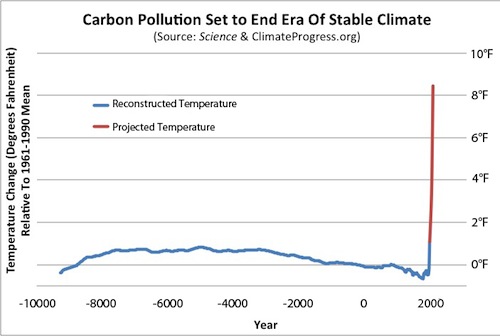
You decide. Should the Hockey Stick be replaced with the Grim Reaper's Scythe?
More information on the climate change graphic HERE.
See more climate change graphics HERE.
If you are not sure what any of this is about, you can read about the Hockey Stick thing here.
Only thing is the curve at the top of the scythe. Really important to avoid giving the impression that things can go backwards in time. :-)
I know, but I did get a handle with a nice ME. warm period curve in it!
Nice job. Do you think it will really curve backward in time, like the scythe? That could give us a few more years ...
Ah, according to the graph, the Earth's average temperature will be 180F by 2300...sounds legit. (The underlying data used in the graph was found to be flawed, there isn't a blue uptick like that)
Clifton, the graph does not show 2300, so no. Graph reading is hard, though, this may help:
http://www.studyzone.org/testprep/math4/d/linegraph4l.cfm
The underlying data on which the graph is based were not flawed. The choice of color of the uptick is really not important.
If the graph is flawed there will be peer-reviewed publications showing exactly is wrong with it. At the moment it is confirmed by some other overlaps for part of it. Till something shows up that withstands peer review in journals calling it so flawed as to be completely wrong I wishful thinking.
--is wishful thinking--
Dan: Read the post, not just the title!
The scythe would be alot more fitting considering what climate change is doing to the enviroment. Just yesterday I heard there are now hybrid polar/brown bears and narwhal/belugas. Check out my blogs to see some more interesting stuff!
http://trevor-maunu.blogspot.com/
http://trevscienceblog.blogspot.com/
So what is your definition of "good scientific estimates?"
Another interesting (and grim) fact about the abundant anthropogenic input of CO2 into our atmosphere is that even if we reduced our CO2 output to 0 today, there will still be a large global increase in temperature. Because the half-life of CO2 follows a negatively exponential scale, there is no possibility of a significant reduction of the atmospheric concentrations of CO2 within the next thousand years. A must-read for those who are interested:
http://forecast.uchicago.edu/Projects/archer.2009.ann_rev_tail.pdf