Last time, we talked about the discovery of dark energy. How did it happen? Well, there are certain kinds of Supernovae, type Ia supernovae, that are practically identical to one another all across the Universe. In fact, we had one happen in our own galaxy in 1572; it outshone everything besides the Moon in the night sky for weeks.

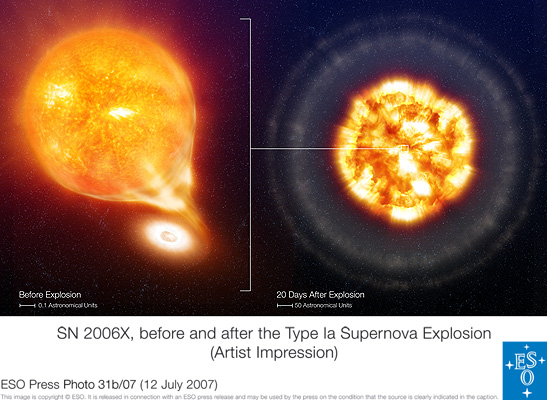
How do type Ia supernovae work? Many solar systems out there are like our own, with one star dominating the system. Others, however, have two or more stars present in the system. Stars up to about four times the mass of our Sun, when they finish burning their nuclear fuel (we've got between 5 and 7 billion years to go for that), have their cores collapse down to white dwarfs. A white dwarf is a super dense object -- about 100 million times denser than Earth -- having a mass comparable to the Sun, but only the physical size of Earth. When there's a companion star nearby, however, the white dwarf can start stealing some of the mass. When the total mass of the star exceeds about 1.4 times the mass of our Sun, the atoms in the center become unstable, and the whole star explods in a type Ia supernova!

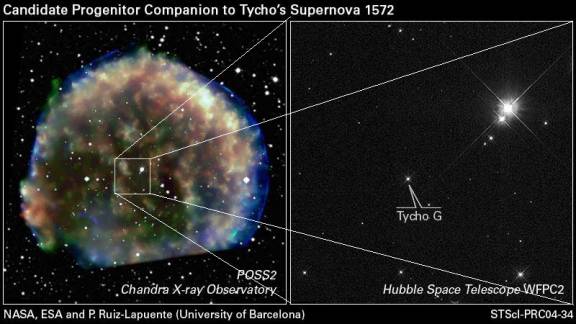
This happens all over the Universe, as the first white dwarfs formed when the Universe was just 150 million years old (barely 1% of its present age). These type Ia supernovae, as far as we can tell, go off regularly for the entire rest of the Universe, up until the present day. In fact, we've even found the binary companion that gave rise to the 1572 supernova!

The two things that make type Ia supernovae special? First off, they're the same at all times. Just like hydrogen atoms are the same everywhere in the Universe, whether it's 200 million years old or 13 billion years old, so it is with type Ia supernovae! In other words, if we see a type Ia supernova, we know that it formed from a white dwarf star tipping past the mass limit. Hence, they should be the same regardless of when in time they occur.
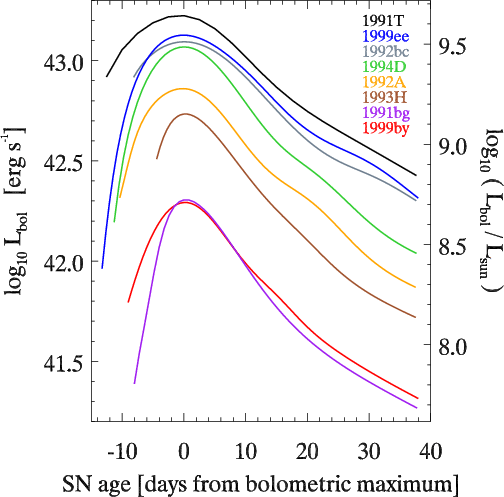
But second, and perhaps more importantly, when we measure the light from a type Ia supernova, we can immediately figure out how intrinsically bright it was, and therefore how far away it is. All you have to do is measure the shape of the light curve, and match it with well-known ones:

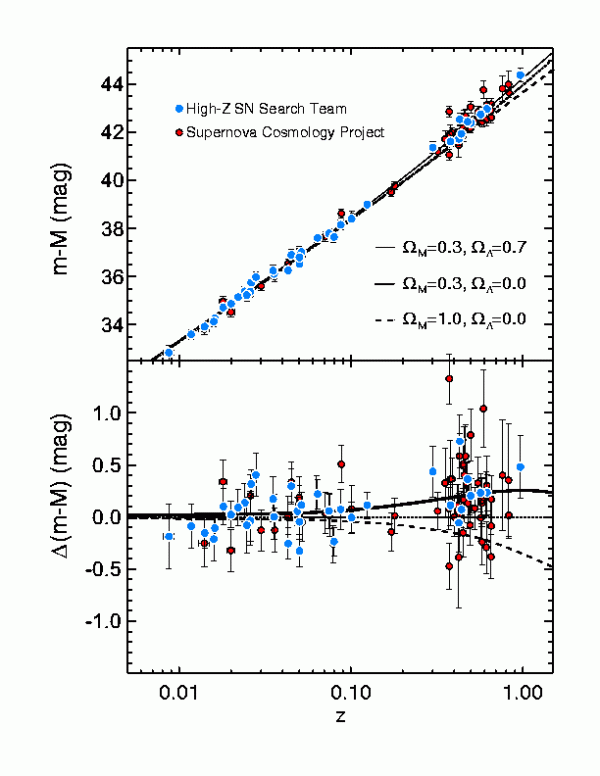
And that's why, when we see these supernovae, we can learn how far away they are. Combine that with a simple redshift measurement, and you can distinguish between a Universe with dark energy and one without it. The data are overwhelming (the one with a 'lambda' in it has dark energy):

And it was this analysis that led us to first accept dark energy as a probable component of the Universe. But once this came out at the end of the 1990s, there were a flurry of alternative explanations that came with it, and a lot of skepticism. Come back for part 3 to learn about it!

OK. Much much better. But 2 questions...
1) could you explain the units of the graph a bit. I'm fine on z, but not at all clear on what m-M is. It also wasn't clear to me initially (and isn't clear to me stall) that best zero-dark-matter case is the middle flat line. Isn't that right? Omega-M observed is 0.27 of critical density, as I undestand it, hence Omega[m]=0.3, Omega[lambda] is the preferred choice for the Omega[lamda]=0 case. Perhaps you clarify what the three lines are.
2) The two outliers in the upper right. As I understand it, there's a second proposed mechanism for Type 1A supernovas -- namely collision of two white dwarfs, producing a white dwarf with super-Chandrasekhar mass, which are overbright. I'm hoping one of the counterarguments you will present is the hypothesis that white-dwarf/white-dwarf collisions are more common in the early universe.
Thanks.
"m" is the apparent magnitude of the supernova, which is proportional to the logarithm of the luminosity measured by the telescope. "M" is the intrinsic magnitude, proportional to the logarithm of the brightness of the supernova at it some reference distance (generally 10pc, I believe). "m - M", then, is the logarithm of the ratio of the observed brightness to the intrinsic brightness of the supernova.
So, put shorter: "m - M" is a measure of the observed brightness as compared to its intrinsic brightness.
the data look more like a shotgun pattern than a convincing correlation. Lotta scatter there. I can see that the lowest dashed line (Omega-M = 1.0) is ruled out, but I don't see that the data differentiates between the lambda=0 and lambda=0.7
David: You are correct that that figure by itself does not prove that Ω_Λ > 0, although to my eyes the nonzero dark energy curve looks more likely.
However, that figure is not the only evidence we have. We have good reasons for thinking that Ω_M + Ω_Λ = 1. Specifically, if post inflation the sum were a little bit different from 1, it would now be a lot different from 1 (this is the same argument which leads us to conclude that there was an inflationary period in the first ~10^-37 seconds of the Universe). There are also other techniques for measuring Ω_Λ, and the error ellipse in Ω_Λ-Ω_M space now excludes the no dark matter option to at least the 3σ level.
What is dark energy? Can it be detected it in the laboratory? Even after 16 years the dark matter has not been detected in the laboratory. Since the dark matter has been around for 70 years and the dark energy has been around for 10, maybe its time to ask the fatal question: Are these concepts are like the aether and the epicycles--concepts whose real value is that they keep the the old failing theory alive?
Maybe it is time to stop experimenting and start thinking.
Like:
It can be argued that the idea that mass mediates the gravitational force is as unphysical as the 1000 year-old idea held by the Scholastics that the earth has some mysterious property that enables it to make all the objects in the sky revolve around it in a 24 hour period.
The Stephan-Boltzmann law says that if mass has a temperature it has heat leaving it in the form of radiation. Could it be that it is not the mass that mediates the gravitational force but the heat leaving it in the form of radiation that all along has mediated the gravitational force?
In my paper I have five experiments that show the weight of test mass will either increase or decrease by as much as 2-9% depending on the direction with which the heat transfers itself through the test mass. It is entitled "Is the sun's warmth gravitationally attractive?" and it can be found here: http://vixra.org/abs/0907.0018
David @#3, don't despair. There's more coming to the series, and there's a lot more we know about dark energy than simply this one graph (from nearly a decade ago) that I've shown you.
Peter Fred @#5, your theory is possible in principle, but easily disprovable in practice. Notice how the same laws of gravity apply to our celestial bodies whether they're in an eclipse (shielded from the Sun) or not? There you go.
Please do not advertise your own pet theories here, especially if they are not even relevant to the topic of the article.
awesome blog
Hmm, do you have a statistical analysis of that data on the SN1 magnitude? Just looking at the points and error bars, overwhelming is NOT the word I'd use.
Ethan's data of Ia supernova observations is absolutely correct, as far as I understand.
I agree totally when he says, "when we measure the light from a type Ia supernova, we can immediately figure out how intrinsically bright it was, and therefore how far away it is."
But when Ethan says, "Combine that with a simple redshift measurement, and you can distinguish between a Universe with dark energy and one without it"; I have a slight disagreement with Ethan. The problem with this second statement is that it assumes a flat-Euclidean "visible Universe" (which neither Einstein nor Hubble assumed).
In a spherical-Riemann Einsteinian 3-sphere "visible Universe", the rays of light do not follow straight-euclidean lines; rather they follow geodesic lines. Thus the Ia supernova observations and data which Ethan so correctly explains; needs to be interpreted instead as a big clue in determining the curvature of our "visible Universe" visa vi Einstein and Hubble's 3-sphere suggestion. In such a 3-sphere interpretation the "apparent dark energy" is a non sequitur.
Thus the difference between the redshift data and the Ia supernova luminosity data is simply due to the curvature of our "visible universe". Consider for a moment a 2-dimensional globe, light from a 2-dimensional Ia supernova following the geodesic (i.e. gravitational curves) would not agree with Ethan's Euclidean assumption. (pg 67-68)
Sorry, I mispoke when I said, "I agree totally when he says, "when we measure the light from a type Ia supernova, we can immediately figure out how intrinsically bright it was, and therefore how far away it is."". Already the 3-sphere problem is creeping into a correct interpretation.
My point simply is that both the "intrinsic brightness" data and the "redshift" data are not to be disputed. They are correct observation data, bedrock physics. However, the theoretical assumptions that we use to interpret these data make a big difference as to whether "dark energy" is a reasonable or even necessary hypothesis.
For those who want a statistical analysis of the points on the error bars : yes, it has been done. Here is a page that has some of it: http://brahms.phy.vanderbilt.edu/~rknop/research/papers/hstpaper/index…
That's not for the particular data set plotted there, but it's from my own paper from several years ago, so I'm trumpeting my own horn :) Here is the plot that has the statistical analysis: http://brahms.phy.vanderbilt.edu/~rknop/research/papers/hstpaper/figure…
The ellipses are confidence intervals. The innermost ellipse is the 68% confidence interval, equivalent to "one sigma". That means that we're 68% confident (in terms of the normal statistics we're using) that the Omega_M Omega_L pair falls somewhere within that ellipse. The outer dotted ellipse is the 99% confidence interval.
The probability from these supernovae alone (in the Knop 2003 paper) that we've got Omega_Lambda > 0 is 99.99something percent. If you add in an additional constraint either from clustering data or from the cosmic micraowave background, you get to add a whole lot more 9's to the end of that.
Here is a paper that combines lots and lots of data sets and has stronger statistical constraints than in the image I just linked to:
http://adsabs.harvard.edu/abs/2008ApJ...686..749K