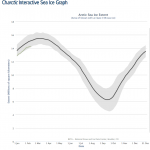
Arctic Sea Ice

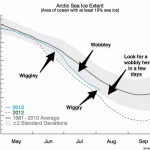
Above is the nifty interactive graphic from the National Snow and Ice Data Center showing sea ice extent in the Arctic for the current year (the lower squiggle). This year's squiggle looks like a peak, and it is possible that Arctic Sea ice extent is now on the decline. Minimum extent is typically reached in September.
The other squiggles are all the years since 1979 that seem to have had peaks later in the year than this year's apparent peak of a couple of days ago. Those years are 1992, 1997, 1999, and 2010. In other words, for the available data set, four out of 34 years, or just over…

A few days ago I made a prediction for this year's minimum Arctic Sea Ice extent. That's still valid. Or not. Either way, it's still my prediction.
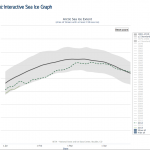
But looking at the ice over the last few days, we see that for the first time in a while the extent of ice estimated by the NSICD has stopped hugging the -2SD line and is rising upwards like a chilly Phoenix rising out of slush ashes. In fact, one could even say that Arctic Sea Ice has recovered! Just look at the last eight days of data!
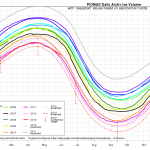
Think I'm cherry picking? It's possible, let's look at the larger picture, over a whole year's cycle:…

Peter Sinclair has tackled this difficult topic with an excellent video and informative blog post. The blog post is here, and I've pasted the video below.
This is a complicated issue. The water problem in California is obviously made worse by increased demands from population growth and expansion of agriculture. Under "normal" (natural) conditions, California and the American Southwest is fairly dry and can undergo extra dry periods. But climate change seems to be playing a role here as well. It appears that recent lack of rain in the region is the result of changes in atmospheric…

We are reaching the point where Arctic Sea ice tends to max out, in terms of extent (I will not be talking about volume here, though that is vitally important). Using data provided by the National Snow and Ice Data Center, I ran an informal "Science by Spreadsheet" analysis and came up with a prediction for the minimum extent of sea ice this year, which would be some time in September.
This is mostly a seat of the pants analysis and don't take it too seriously, but feel free to put your bets in the comments section.
The data over the last few decades shows a generally declining extent of…
Everything is about ice these days, what with the Winter Olympics in full swing. Concerns that the temperatures at the mountain venue of Sochi would be problematically high have panned out; the lower parts of the downhill slopes are slushy and the bottom of the half-pipe is all bumbly wumply. Injuries and lost medal opportunities are mounting up every day, in part caused by the unusual "Spring" conditions.
We all know the Arctic Vortex has been sitting on the middle of North America, and this has caused near zero F temperatures, often as low as -20F, here in central Minnesota. The same…
During the northern Winter, much of the Arctic is covered with sea ice. Some of this ice melts during the summer, then it regrows. Over recent years, the amount of ice loss in the summer has tended to increase, almost every year, year after year. In 2012 the loss of sea ice was extreme, falling for much of the melting and re-freezing cycle below any year seen before.
The year 2013 was also extreme, with more ice melting away in the summer than almost every previous year, but not to the extent seen in 2012.
Climate science denialist used this fact to make up a story. In this case, the word…

Coldness can manifest where you least expect it: on a planet rapidly warmed by the combustion of fossil fuel, or in the heart of a star 250 times as massive as our own. On Greg Laden's Blog, Greg explains that an apparent "recovery" of Arctic sea ice from its historic low in 2012 does not invalidate the long-term trend. Greg also explains this year's legacy of extreme weather, such as snow in Cairo, writing that when there is less difference in temperature between equatorial and polar regions, "the jet streams get all wiggly and cause northerly air to reach far to the south in some places and…
We call it "weather whiplash." This is not just meteorologists being funny. It is a phenomenon that perhaps has always been with us to some degree, but that has recently become much more common, apparently. If you were under the impression that there is a lot of strange weather going on out there, you may be right, and weather whiplash may be the phenomenon you've noticed. Importantly, there is good reason to believe that weather whiplash is the result of anthropogenic global warming. In other words, it's your fault, so please do pay attention.
Weather patterns tend to move…

Andrew Revkin thinks so:
It is hard to interpret this as meaning anything other than the crisis of Arctic Sea ice melting too much and too fast is over. This is an important thing, because the rapid and widespread melting of sea ice in the Arctic seems to be causing a thing called Arctic Amplification, which means in normal human terms that the Arctic is warmer (amplified) than normal. This causes a decrease in the differential between equatorial heat and polar heat in the Northern Hemisphere which seems to change the way the Jet Streams operate which in turn causes Weather Whiplash, where…
Every northern summer Arctic Sea ice melts away and reforms for winter, but how much melts away seems to be increasing on average, at a rate that surprises climate scientists.
But there are some who see variation from year to year, and there is variation, in a rather unrealistic way. Here is a graph comparing how climate science denialists view arctic sea ice over time, compare to how "climate realists" (i.e., smart people who can read graphs and such) see it:
Go HERE to see the source and learn more about what is behind this graph.
Large ponderous entities like the IPCC or government agencies like NOAA take forever to make basic statements about climate change, for a variety of reasons. They are going to have to speed up their process or risk losing some relevance. Among the coming problems we anticipate with global warming will be events that have huge, widespread effects and that happen in time scales of weeks or months, or a season, and having a nice governmental report about it two years later isn't going to do anybody any good. So let's see to that problem, please (looking sternly at IPCC and NOAA).
But that's…
Remember those puddles at the North Pole that at first everyone said were not important, then when someone realized that they were only puddles so a new meme formed and everyone said they are not important? They're important. From the abstract of a new study, just out:
The surface albedo of the Arctic sea-ice zone is a crucial component in the energy budget of the Arctic region. The treatment of sea-ice albedo has been identified as an important source of variability in the future sea-ice mass loss forecasts in coupled climate models. ... Here we present an analysis of observed changes in…
Obviously, you don't want to help melt the ice cap. But you can help scientists figure out how and why it is happening and to learn important details of what might be one of the most important effects of global warming happening right now.
First, a word on why this is important. Look out the window. If you live in Bavaria, and you look out your window, perhaps you can see fish swimming by because you are in the middle of a huge flood affecting Central Europe. Look out the window. If you live in the American Midwest, it is either raining, about to rain, or it just rained, and you might be…
Since 2001 the amount of Arctic Sea ice that has melted during the summer has generally increased. There may have been a long term trend in melting of ice in the northern hemisphere generally, including mountain glaciers, the Greenland glaciers, and seasonally, Arctic Sea Ice. But the seasonal melting of Arctic Sea ice seems to represent a metastable shift unprecedented in available data. There is probably a tipping point followed by positive feedback. From 2001 onwards, the amount of sea ice melted each summer has gone up, and this has resulted in two related effects: 1) The total amount…
Andy Lee Robinson's latest visualo-info-graphico-depiction of the loss of Arctic Sea Ice:

Time to start watching the Arctic Sea Ice breakup. This happens every year, but as you know, the total amount of ice left each summer has been reducing, and the "old ice" which forms a basis for the arctic ice refreeze is disappearing. The result of this change in arctic ice patterns has been a shift from one form of "arctic oscillation" to another which has resulted in changes in Norther Hemisphere weather.
Here's a new video by Peter Sinclair bringing you up to date on sea ice as well as sea ice melt denialim:
The National Snow and Ice Data Center keeps track of the Arctic ice and…
Here are three iconic graphs (unfortunately, there are many, many more) showing just some of the clear observational evidence that we're changing the climate.
The first is the atmospheric concentration of carbon dioxide, measured at the Mauna Loa observatory in Hawaii. It shows the little ups and downs in concentration that varies with the seasons, but also the inexorable rise in this powerful greenhouse gas. There are now thousands of stations measuring these gases.
The second is the deviation from global average temperatures over the past 130 years. It also shows the natural variability (…
Okay, so this one is a bit of a tear-jerker and I usually like to avoid mixing sentimentality with environmentalism, but it is very informative and interesting if sad. It is greenman3610's Climate Crock of the Week from about three weeks ago and as usual well worth watching.
I tend to be skeptical about anthropomorphizing our fellow earthlings, but I'll be damned if that wasn't a very affectionate mama walrus hugging her baby! If walruses weren't so ugly they just might top polar bears in terms of public concern...